Cycle time is a critical concept for understanding how to make an organization or a team more agile. Cycle time is the amount of time between the start and finish of work. Think of it as a stopwatch time. If you run 100 meters in 11 seconds, that 11 seconds is a cycle time. The amount of time it takes between start and finish of work is a practical, empirical measure of agility.
Cycle time is sometimes referred to using different terms depending on who you talk to or what work you are reading:
- Lead Time – Often used to describe the time from idea to customer delivery. In manufacturing, it typically means the total time from entering a system to exiting it. I prefer to use the term time-to-market for this metric. Some people also use this to indicate the amount of time before an activity starts.
- Flow Time – Often used to describe the elapsed time for a work item to move through a defined system from start to finish.
Some people use these terms interchangeably. In Lean Manufacturing, the terms have very specific definitions where cycle time refers to processing time at a workstation and lead time is the time it takes work to cross the entire assembly line from start to finish. Scaled Agile, Inc. use lead time and flow time.
I prefer to use cycle time for any time that is taken with a stopwatch from start to finish. Since my primary reference for lean concepts is Donald G. Reinertsen’s work, and he only uses the word cycle time, that’s where I center my vocabulary.
Why Cycle Time Matters
Cycle time is a foundational performance metric in operations, manufacturing, and product development. It has been studied for decades because it directly influences cost, risk exposure, and responsiveness.
Cycle time matters for several practical reasons:
- Instrumentation. Cycle time acts as a speedometer on a dashboard, indicating how long it takes to deliver work. Observing changes in average cycle time informs whether changes to the process have slowed or accelerated delivery.
- Forecasting. Percentile distributions of cycle time enable realistic probabilistic forecasting.
- Learning frequency. Cycle time determines how frequently the organization learns from delivery. If cycle time is longer than iteration length, iterations lose the ability to provide a cadence of reviewing results and replanning.
- Ability to adapt. When priorities change, less capital is tied up in partially completed work, making redirection less costly.
- Manage risk. Longer cycle times increase the cost of delay, exposure to market changes, and accumulated sunk cost before validation.
Without measuring cycle time, leaders lack visibility into how their system actually performs.
How to Use Cycle Time
Cycle time is the measurable expression of agility. I define agility as the ability of the organization to respond to change or to initiate and complete change themselves for competitive advantage. The amount of time it takes to complete work is the turn radius of the organization. It largely determines the time-to-market of the organization. If an organization delivers quickly but ignores feedback, speed alone does not make it agile.
Cycle time enables empiricism. Iterative and incremental delivery frameworks are only as valuable as cycle time is short. Consider this a rule:
If Cycle_Time > Iteration_Length,
➜ iteration ≠ cadence of learning
Scrum and xP are designed around work being started and finished within the same iteration. If work becomes “carryover” to the next sprint, then the sprint review turns into a session where work is only reviewed every other sprint.
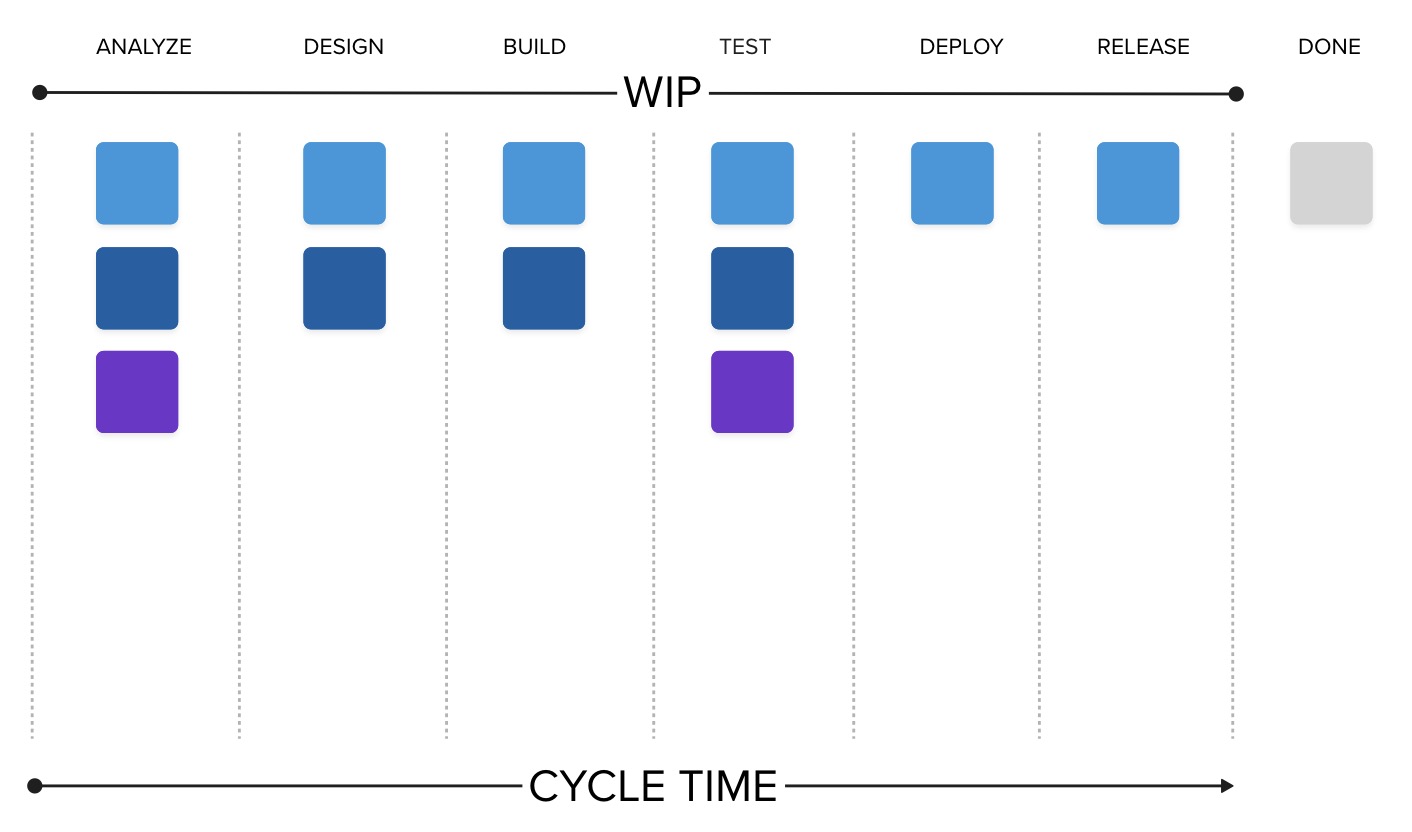
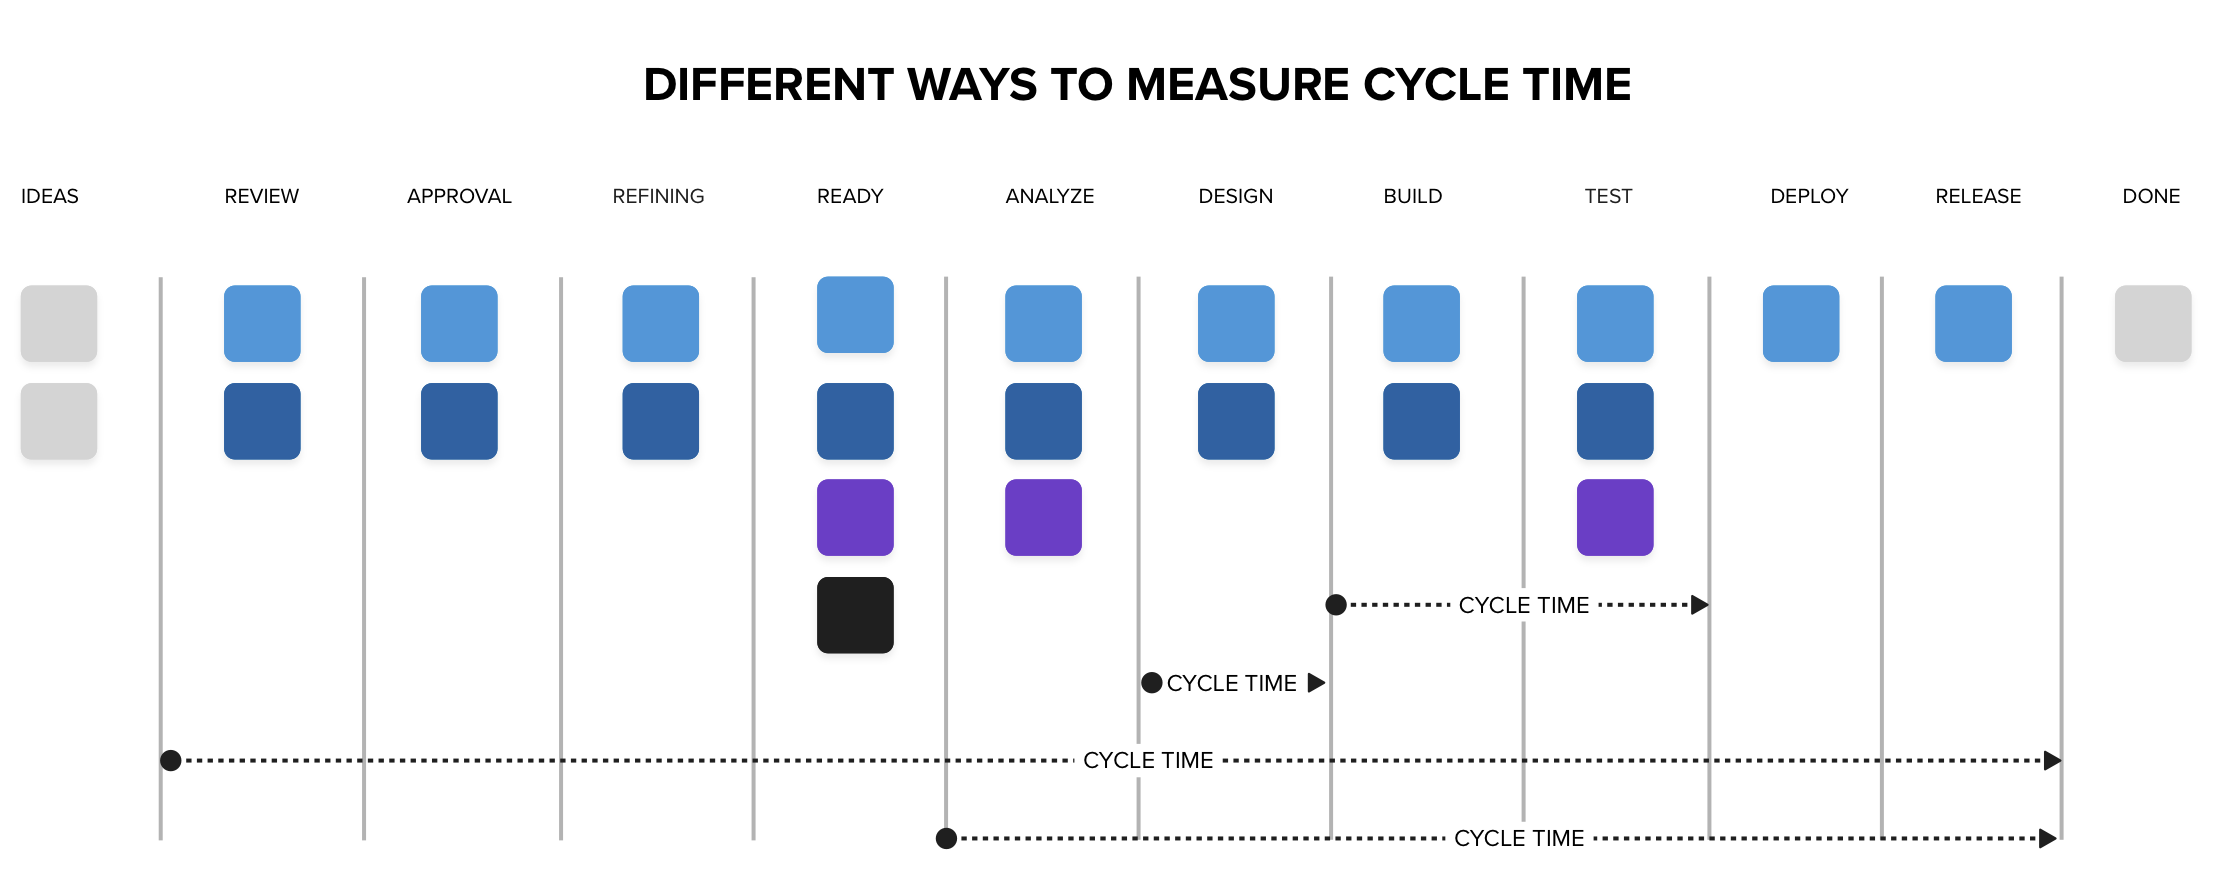
Cycle Time exposes bottlenecks. You can measure the cycle time from idea to market, from customer feedback to release in response, or from any point to any other. Measuring cycle time across specific steps reveals where work slows and where queues form.
Cycle time creates transparency by making waiting, rework, and dependency delays visible.
How to Reduce Cycle Time
To improve agility, cycle time must be reduced. There are structural, quality, economic, and cultural levers available to influence cycle time.
Structural
- Reduce Batch Size – Smaller batches reduce complexity, lower variability, and allow work to flow more quickly, reducing cycle time.
- Limit WIP – Reducing the number of things in-progress lowers cycle time.
- Decentralize. Bottlenecks are often caused by centralized control or centralized processing. Work flows faster when control is decentralized to empowered teams.
- Reduce handoffs. Eliminating handoffs reduces queueing caused by functional silos and dramatically lowers cycle time.
- Eliminate extra process steps. Most processes are heavily embellished with approvals, reviews, status meetings, and other steps that delay work completion and provide little value beyond perceived control.
- Address bottlenecks. Find where work queues and address the causes of that buildup. The longest queue determines overall cycle time.
Quality
- Automate time-intensive tasks with long cycle times. Automating things such as environment creation, data collection, build, packaging, and deployment can speed up cycle time for those tasks.
- Reduce defects. Defects cause rework, and rework consumes capacity. If a defect escapes a team, the cycle time clock for that work item should continue running. Most tooling does not support this.
Economic
- Utilization. Staff appropriately. High utilization increases total system cost by expanding cycle time. Cycle time also costs money, so if everyone is fully busy, queues will form that delay work completion far beyond the cost of allowing employees and contractors alike to have idle time. Worrying about everyone being busy enough causes a system to shut down. Instead, focus on people being available and work being busy. Idle capacity is cheaper than long queues.
Cultural Shift
- Change how things work. Too many leaders hope they can “go agile” without changing how things work. That approach typically yields limited improvement in cycle time. Structural change is required for meaningful reduction in cycle time. Incremental change is possible and often recommended. Using that as an excuse to avoid structural change will leave cycle times high and agility low. Waterfall and similar project-based large batch work systems in organizations with functional silos struggle with lowering cycle time. Old structures, teams, processes, and control mechanisms must be redesigned and replaced by empowered teams, small batch work, and constrained WIP.
How to Measure Cycle Time
Measuring cycle time is easily done:
Cycle Time = (Finish Date - Start Date) + 1When measuring in whole calendar days using dates rather than timestamps, both the start and finish day are counted. This avoids reporting zero-day cycle times and aligns with common day-based tracking systems. Most software development teams measure cycle time in days. Larger time units, such as weeks or months, obscure meaningful variation and reduce analytical precision.
Important:
- Common denominator. If cycle time is measured in days, WIP and throughput must also be expressed per day. Otherwise, Little’s Law will not balance.
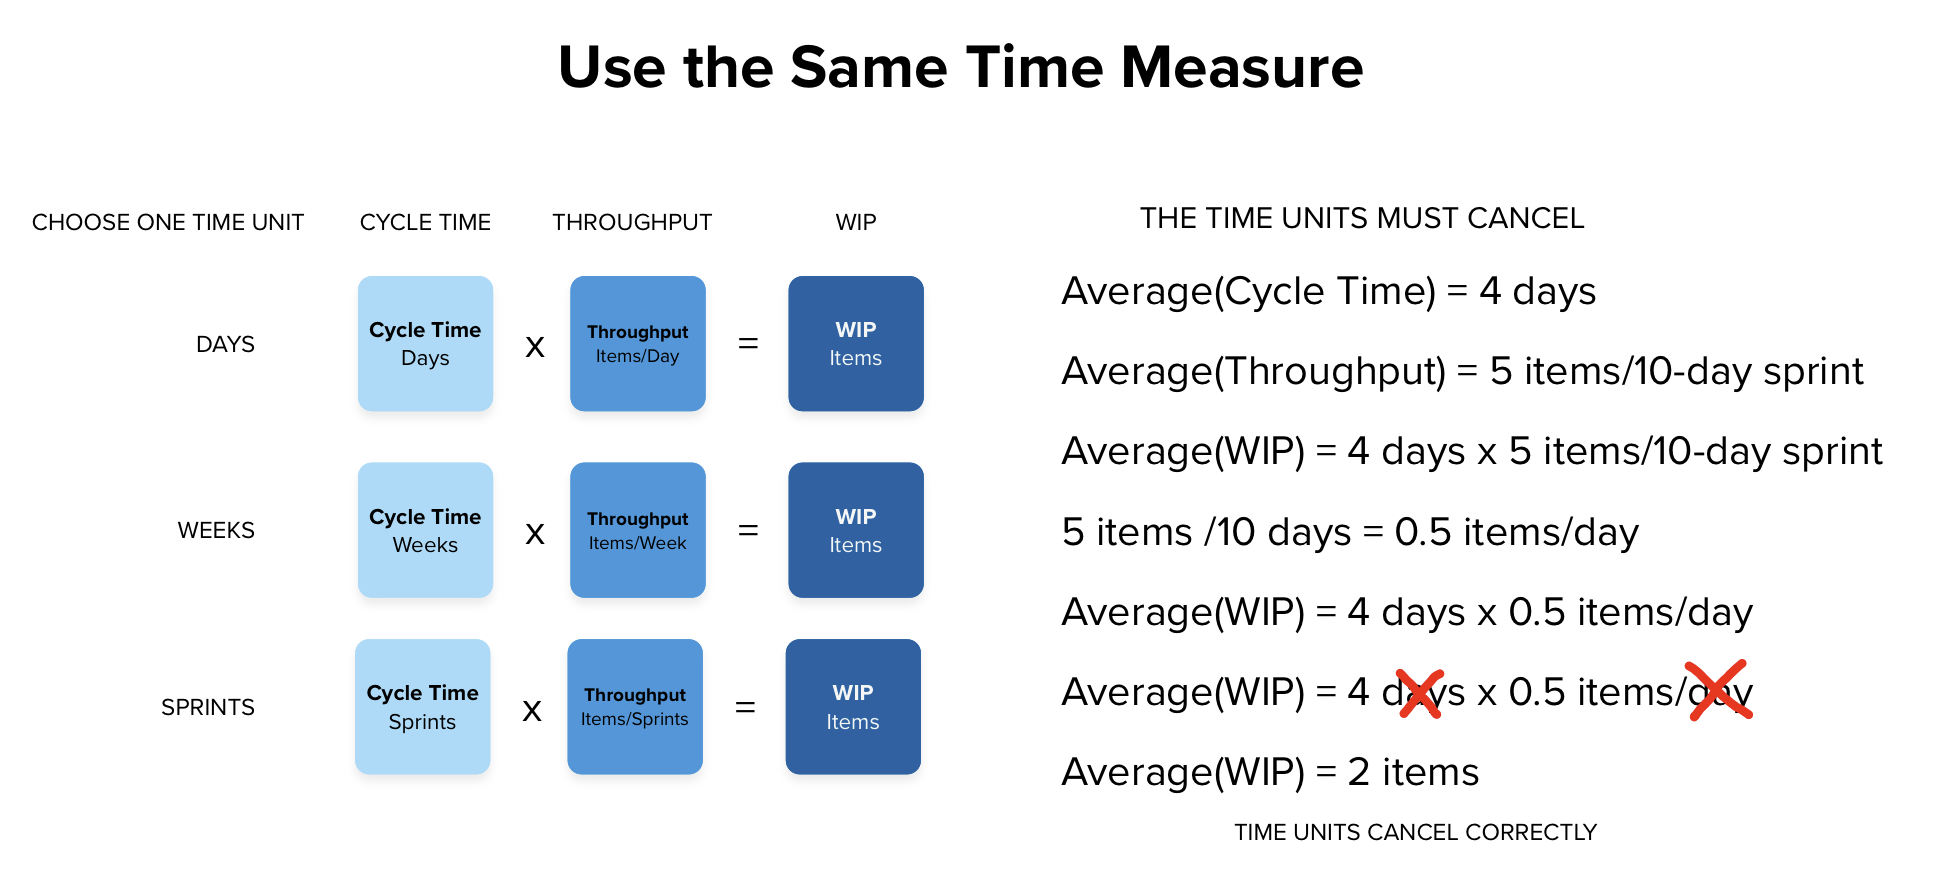
- Add one. When using date-based measurement in whole days, count both the start and finish day. This inclusive counting model is standard in many software tracking systems and prevents reporting zero-day durations. Even a partial day should count as a full day when using whole-day measurement.
- Match WIP. The cycle time measured must correspond to the WIP being analyzed. If measuring cycle time for a single workflow step, use the WIP for that step. If you are measuring the entire system, then all WIP in the entire system is what is measured.
Cycle time should be analyzed using both averages and percentiles. Averages are useful for observing trends over time and for providing the instrumentation mentioned earlier. Averages are not useful for predictability. Cycle time often is highly variable. Some work items complete quickly; others take longer. Cycle time data is often not normally distributed.Promising the average to a customer often results in a low probability of success.
For delivery expectations, percentile-based measures are more useful than averages. Service Level Expectations (SLEs) are typically expressed as “X% of items complete within Y days.” This reflects probability rather than prediction. This makes risk explicit rather than implicit.
Optimize the Whole
Many organizations try to improve time-to-market by focusing on isolated areas such as writing code. In practice, writing code is rarely the long pole in the tent. Systems thinking requires optimizing the whole in order to get large improvements. Long time-to-market is usually driven by up-front comprehensive planning, excessive preparation before starting work, and post-development release scheduling or centralized testing gates.
To optimize such a system, focus on the big ticket items. Smaller batches and reducing detailed up-front planning will help. Releasing work items individually instead of in scheduled releases will help. Eliminating centralized testing gates and shifting validation into cross-functional teams will also help. Optimizing the whole system is the only reliable path to sustained reductions in cycle time.
Last updated 2026-02-19