
The word “agile” literally means the ability to move quickly. Agility is often described in terms of delivering value and satisfying customers. Those outcomes matter. In this article, agility is treated as a structural property: the ability of an organization to move and adapt quickly. In product development, that movement is measured by time-to-market. Time-to-market is the number of days it takes for an idea to move from conception to delivery into the hands of a customer. The lower the time-to-market, the more agile the organization.
If you ask me to assess how agile your business is, I will ask you in return, “How many days does it take from the moment someone has an idea until that idea is in the hands of a customer?” If your organization does not know that number, you are not measuring agility.
Use of Time-to-Market
Time-to-Market is very useful:
- Strategic response time. Strategic responsiveness. TTM measures how quickly the organization can respond to threats and exploit emerging opportunities. When a window opens, the organization has a limited time to move before it closes.
- Cost to build. Longer duration increases holding costs, coordination overhead, and risk exposure.
- Transparency of value stream health. TTM exposes systemic delay across the entire value stream rather than within isolated teams.
- Continuous improvement. TTM becomes the control variable. If it rises after a process change, the system has degraded.
Many internal cycle times exist within a value stream. Only end-to-end time-to-market reflects overall system performance.
Time-to-Market is a Cycle Time
Time-to-market is a cycle time measure of the entire value stream, end-to-end. Therefore, it is subject to Little’s Law:
CYCLE_TIME = WIP / THROUGHPUTWork-in-Process (WIP) is the number of items currently inside the system. Throughput is the rate at which items are completed and delivered.
Cycle time is composed of waiting time plus service time:
CYCLE_TIME = WAITING_TIME + SERVICE_TIMEService time is the time spent actively working. Waiting time is the time an item spends idle in queues. As system utilization increases relative to capacity, waiting time grows nonlinearly and becomes the dominant component of cycle time.
Throughput increases only when the system’s bottleneck improves. The bottleneck is the slowest step limiting overall output. Process remediation at that constraint is essential. Automate testing, build, integration, and deployment where they restrict flow. Remove manual approval steps that delay work. Empower teams to make decisions without vertical escalation.
Once bottlenecks are addressed, limiting WIP becomes essential. High WIP produces scattered focus, delays, and context switching. Low WIP produces focused attention and faster flow.
WIP should not only be measured. It must be constrained. When you limit how many items are worked simultaneously, multitasking declines and queueing delays shrink. Waiting time increases nonlinearly as utilization approaches full capacity, making WIP limits one of the most powerful levers for improving flow.
Leaders often say, “There is too much going on.” That observation is correct. Do fewer things at once and more will finish. That is predicted by queueing theory. As utilization rises beyond roughly 75–80 percent, waiting time expands rapidly and cycle time follows.
But none of this gives you the full picture.
Optimizing the Local Does Not Guarantee System Improvement
Let’s say you work in a factory. One station on the assembly line figures out how to double its speed. Great news, right?
Not necessarily.
If that station is not the bottleneck, the overall speed of value delivery does not change. Work simply accumulates between steps. Local optimization will not translate into global improvement.
This same pattern appears in software, marketing, operations, and other complex systems. That is why we must look beyond the team or departmental level and start measuring across the entire system.
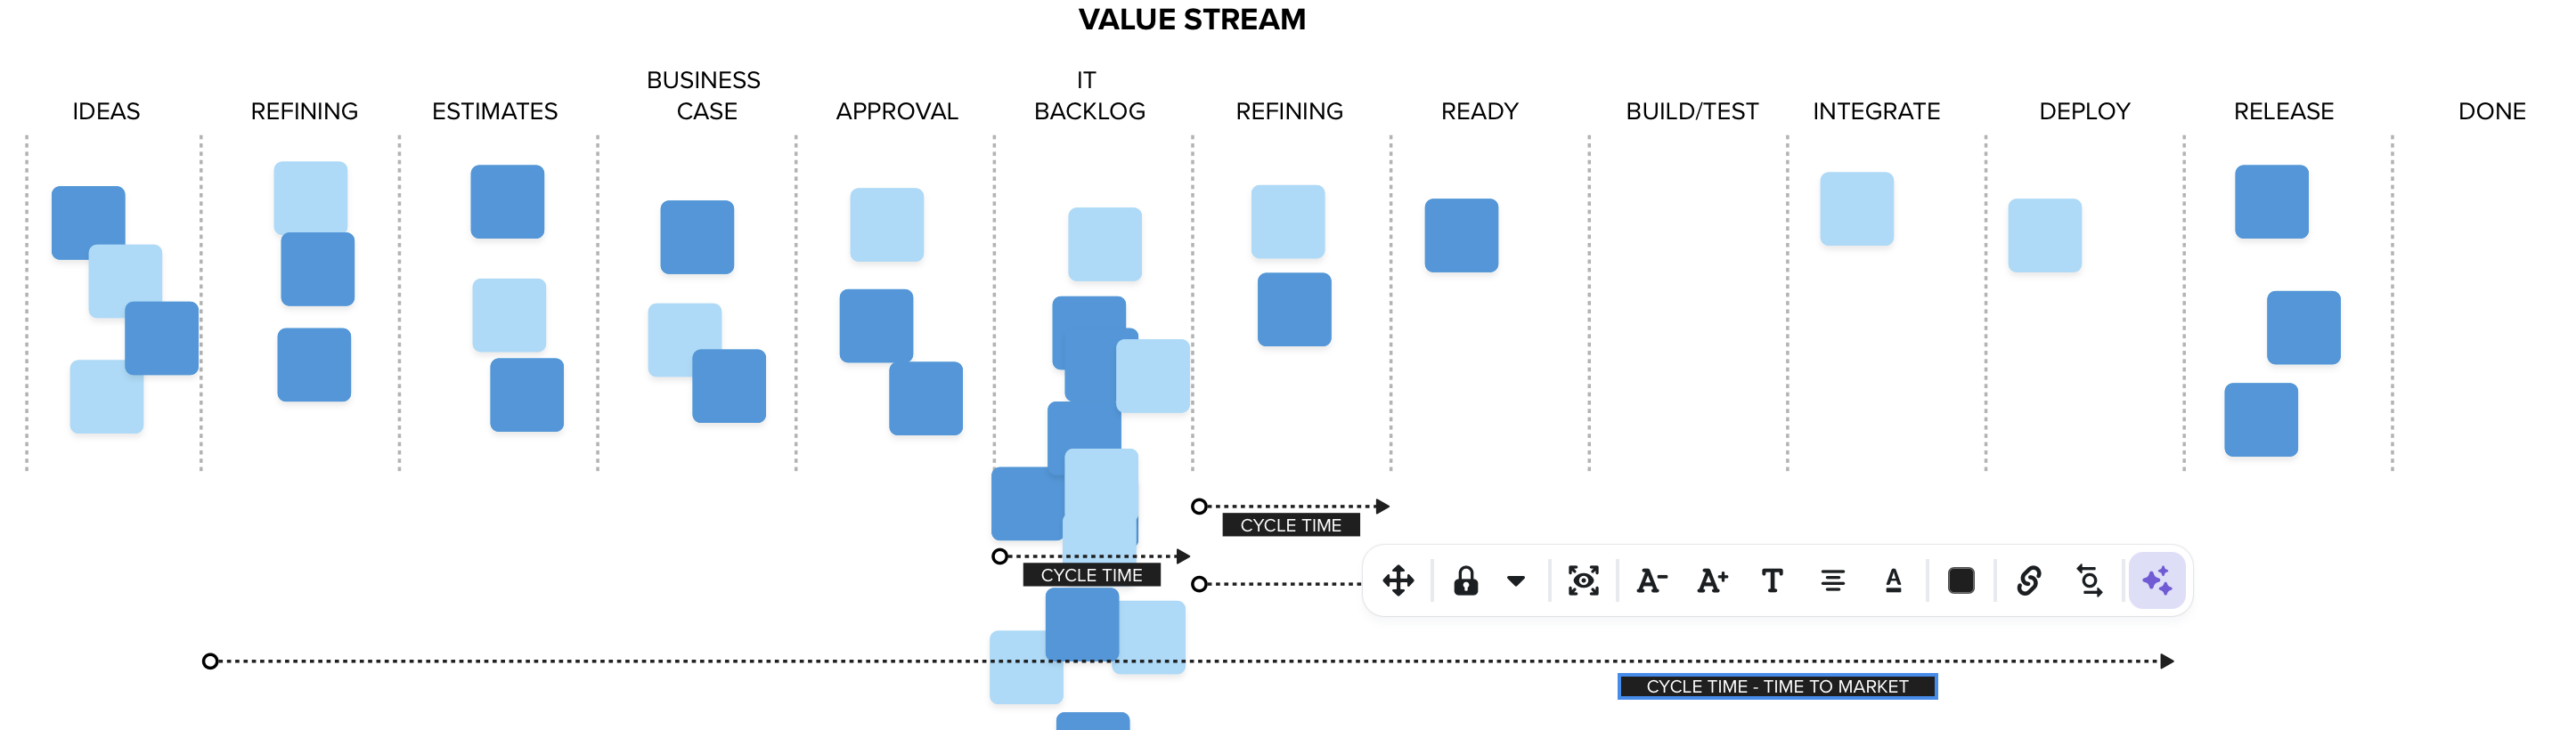
Time-to-market stretches across the whole value stream from idea to delivery.
It starts at the moment a request is born: a customer gives feedback, a sales rep logs a need, or a product manager writes down a hypothesis. And it ends when value is delivered: the new feature is in production and being used by real customers.
This is the number that reflects overall organizational responsiveness.
If your team tells the CEO, “Our average cycle time is 5 days,” that is good, but it is only part of the story. If the time-to-market from idea to delivery is 120 days, then the organization still suffers from late delivery. Agility exists locally but not systemically.
Time-to-Market Measures Agility at the Organizational Level
In the end, time-to-market is the metric that tells a business how quickly it can respond to opportunity or change. It measures how long customers wait and how quickly the organization can learn from real feedback. Put your time-to-market up on the wall. Review it regularly. When someone makes a process change, and the time-to-market goes up, consider rolling the change back.
Scrum teams, Kanban boards, Lean initiatives: do not improve organizational agility if time-to-market remains unchanged.
If the goal is enterprise-level agility, not just at the team level, but across the enterprise, then start by measuring time-to-market across the full value stream.
Only then can you identify systemic delays and improve overall flow.
If you are interested in learning more about measuring the performance of your software factory, then consider taking a look at Scrum.org’s Evidence-Based Management Guide. You will find many different measures of Time to Market in there..
Here is an interesting article by Steven Thomas about chaos and confusion surrounding naming different kinds of cycle times.