Many software development teams are doing estimation in story points using a technique often referred to as relative estimation. In my article Estimating the Value of Story Points, I pointed out that estimating in story points fails to correlate to cycle time outcomes, meaning that story point estimates are measures of effort, not cycle time. I asked the question, “What is the value of estimating effort if it doesn’t predict delivery outcomes?” I also questioned the value of relative estimation itself. What is the virtue of comparing two things in size and labeling each of them in comparison to one another?
In this article, I will discuss a common defense of story point estimation called Velocity Variance. Velocity variance is the variation between the velocity of sprints. One sprint may have a high velocity, meaning many story points were completed, and another sprint may have a low velocity, or a low number of story points completed. The difference between the highs and the lows is the variance in velocity.
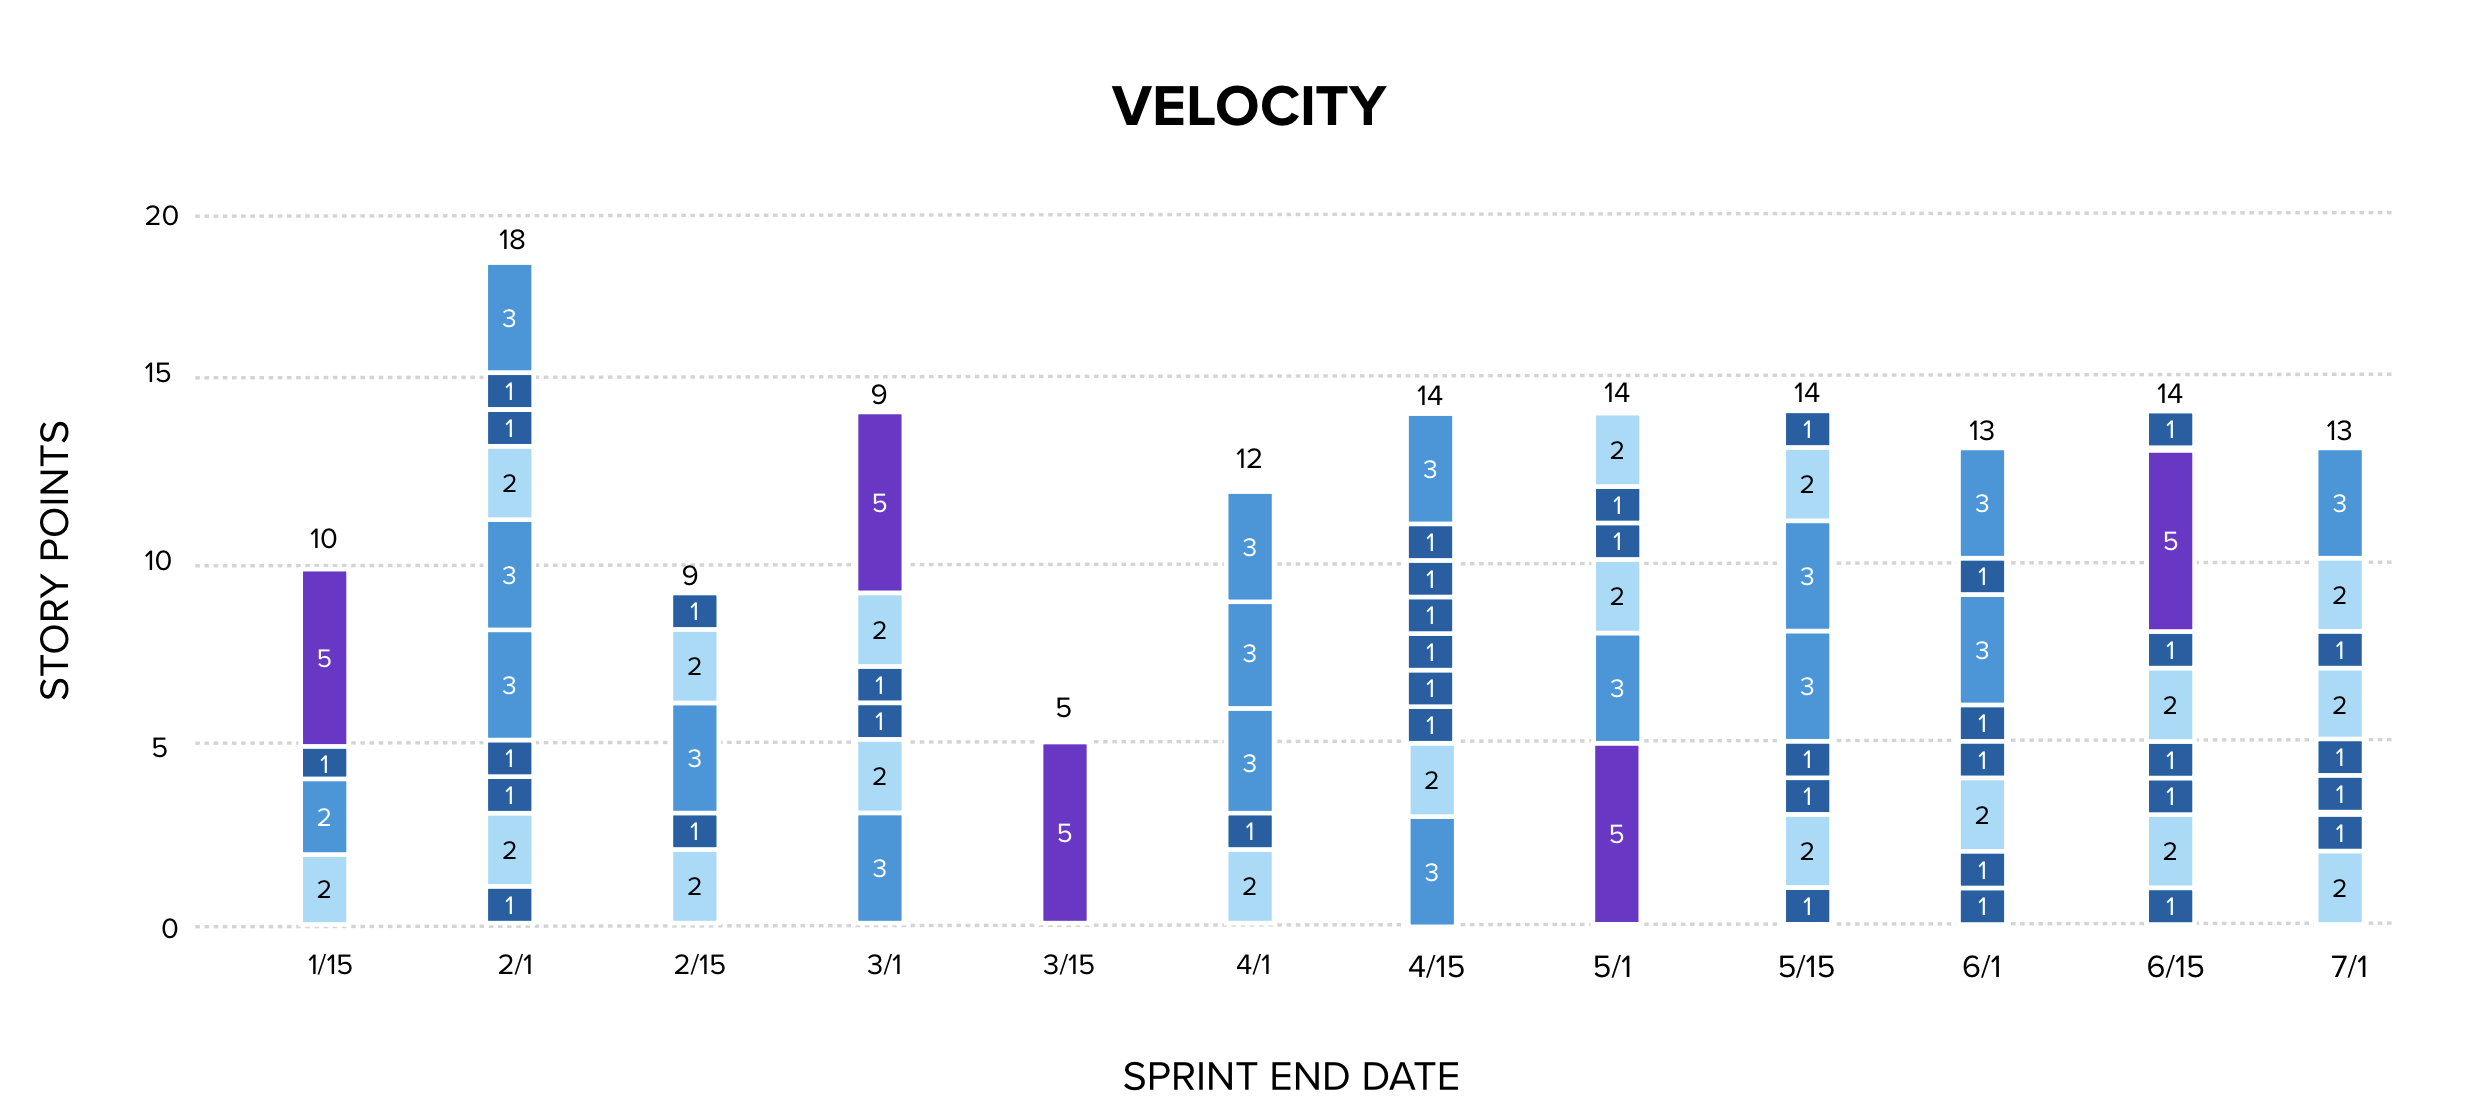
Below is a column chart showing the velocity of a software delivery team between January and the end of June. Each item is represented as a colored block, the story point estimate of the work item is the number on the block. The total story points delivered each sprint is at the top of the column. This chart is read by someone who believes velocity variance to be significant because it tells a success story: the variance between highs and lows is high on the left, and over time, the velocity converges around 13.5. A coach who taught this to a team might believe that the team has learned to improve estimation and has become predictable finding what they are truly capable of and selecting the appropriate amount of work for each sprint.

This chart appears on its surface to be data-driven and important. We can see how many things we delivered during each two week period (throughput), and we can see the size of each item.
Or can we?
The size numbers are estimates that the team made before performing the work. Those numbers are not the actual sizes of the work completed. They are guesses that the team made about size. Each size assigned to a work item as an estimate has a probability to be the actual size. That probability is generally quite low in software development. This chart cannot be used as historical data of sizes, but rather of estimates.
The variance in velocity is mostly estimation error. The argument for attempting velocity variance as an analysis is that it if estimates are unstable, the team is unpredictable.. By measuring the variance in estimates over time, we can demonstrate that the team is becoming more predictable as they improve. The claim is that the team learns to make better estimates, and as the columns start to zero in on a consistent amount of story points delivered each sprint, it serves as evidence that the estimation process is improving.
Unfortunately, the stabilization seen on the right of the chart does not demonstrate that. It demonstrates that the team has discovered the number to always choose for their total estimate, not that they are improving the system that they are managing. There is also a tendency for the team to converge on a politically acceptable number, not a statistically meaningful one.
There is no evidence here that estimates are improving or stabilizing to provide predictability. The stabilization at 13-14 could mean the team is completing roughly the same amount of work each sprint. It could equally mean they are pulling items until the estimate total hits 14 and then stopping. Or that the mix of 1s, 2s, and 3s they happen to finish sums to roughly the same number by coincidence. The chart cannot distinguish between these explanations, and the first is the only one that constitutes actual improvement.
Repeated experience with estimates in software development shows that they have a low correlation coefficient with actual outcomes. I have had many thousands of projects managed within my organization or by myself during my decades in management in software development. I have observed no correlation between estimates and actual outcomes. When performing multiple exercises comparing estimates to costs, days to deliver, completion dates… these things only come near the original estimates on projects when a large number of change requests are repeatedly processed to change scope, schedule, and cost estimates as the delivery date approaches. It is why software development adopted iterations: to provide short enough timeline that the inaccuracy of estimation could be mitigated. Or, perhaps estimates themselves would be unnecessary as the team is working on a fixed cost, and sizing work to complete in a few days is easier than performing long-term estimation.
No software development project manager would accept a $1,000 bet that they could deliver a multi-month project on time, on scope, and on budget as agreed before work began without any change requests allowed. They would be foolish to do so, as the odds of nailing that plan on scope, schedule, and cost are very low.
Since estimates correlate poorly to actuals, totaling up the estimates and analyzing them for accuracy without an outcome measure is an expensive yet non-useful activity.
If we remove the story point sizes from the estimates, we get the chart below.
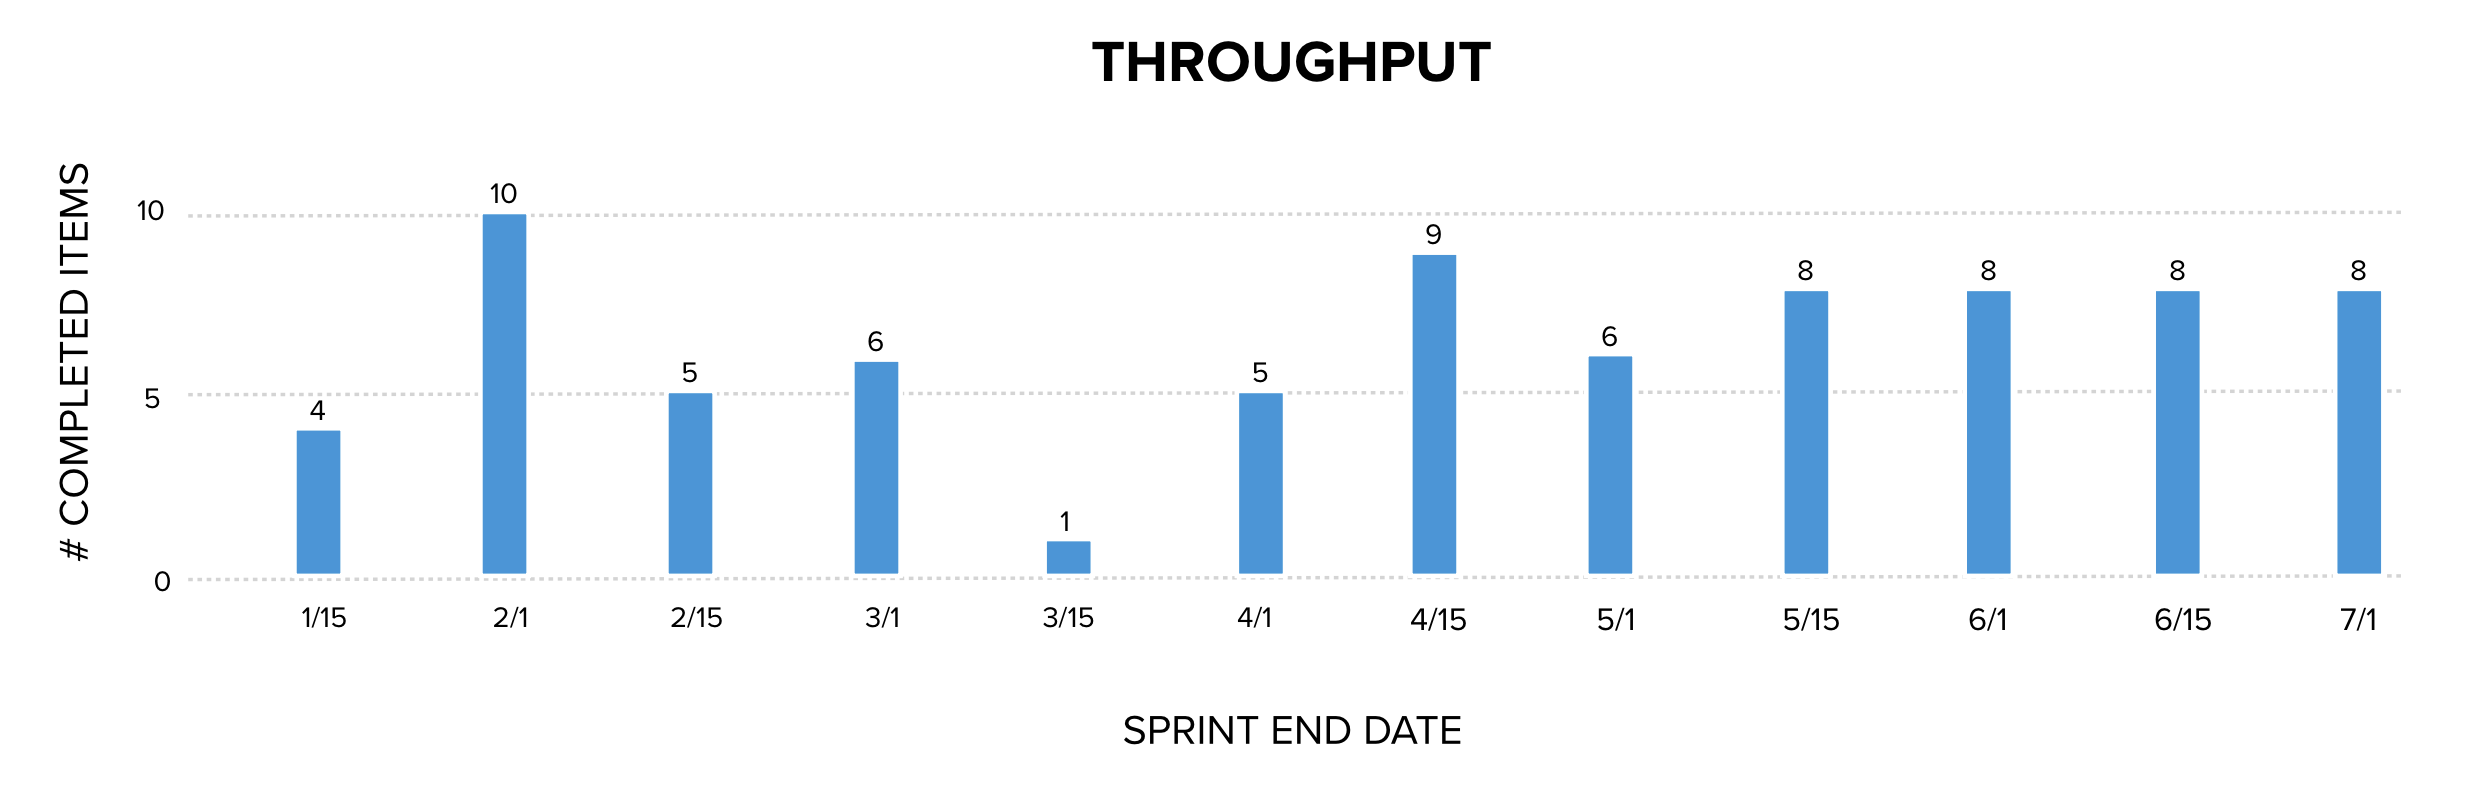
Without the sizes on each of the work items, instead we are now seeing observable facts about the number of things completed each sprint. Throughput is factual, historical data collected. Throughput is a useful measurement because it is one of the variables in Little’s Law that describes how work-in-process, cycle time, and throughput relate to one another in any process. Throughput is a valuable measurement that is collected and used in calculating Monte Carlo Analysis to predict the probability of completing a number of items by a range of dates. Monte Carlo Analysis is well-established in queueing theory and reliability engineering and is used in many industries to forecast system performance based on historical data.
What does this mean? It means that velocity is throughput with a noisy multiplier. Since the sizes were guesses, they are not measurements. They cannot be input into a statistical process control as data and used to forecast future events.
Champions of velocity attempting to defend relative estimation will argue that it is the variance between the estimates that is important, because it helps a team learn to estimate better by comparing their total estimates completing each sprint. They will say that by measuring the variance in estimates from sprint to sprint, the team can slowly zero in and improve their estimation to become predictable.
They are attempting to apply statistical process control to story points as if they are a historical measure such as dollars spent, hours consumed, days to complete (cycle time), or number of items completed per unit of time (throughput). But story points are not a measurement of something that happened. They were a guess.
To improve the team’s ability to predict their delivery, instead of story points, a cycle time measure would need to be added to the throughput chart and the points removed. That chart would look like this:
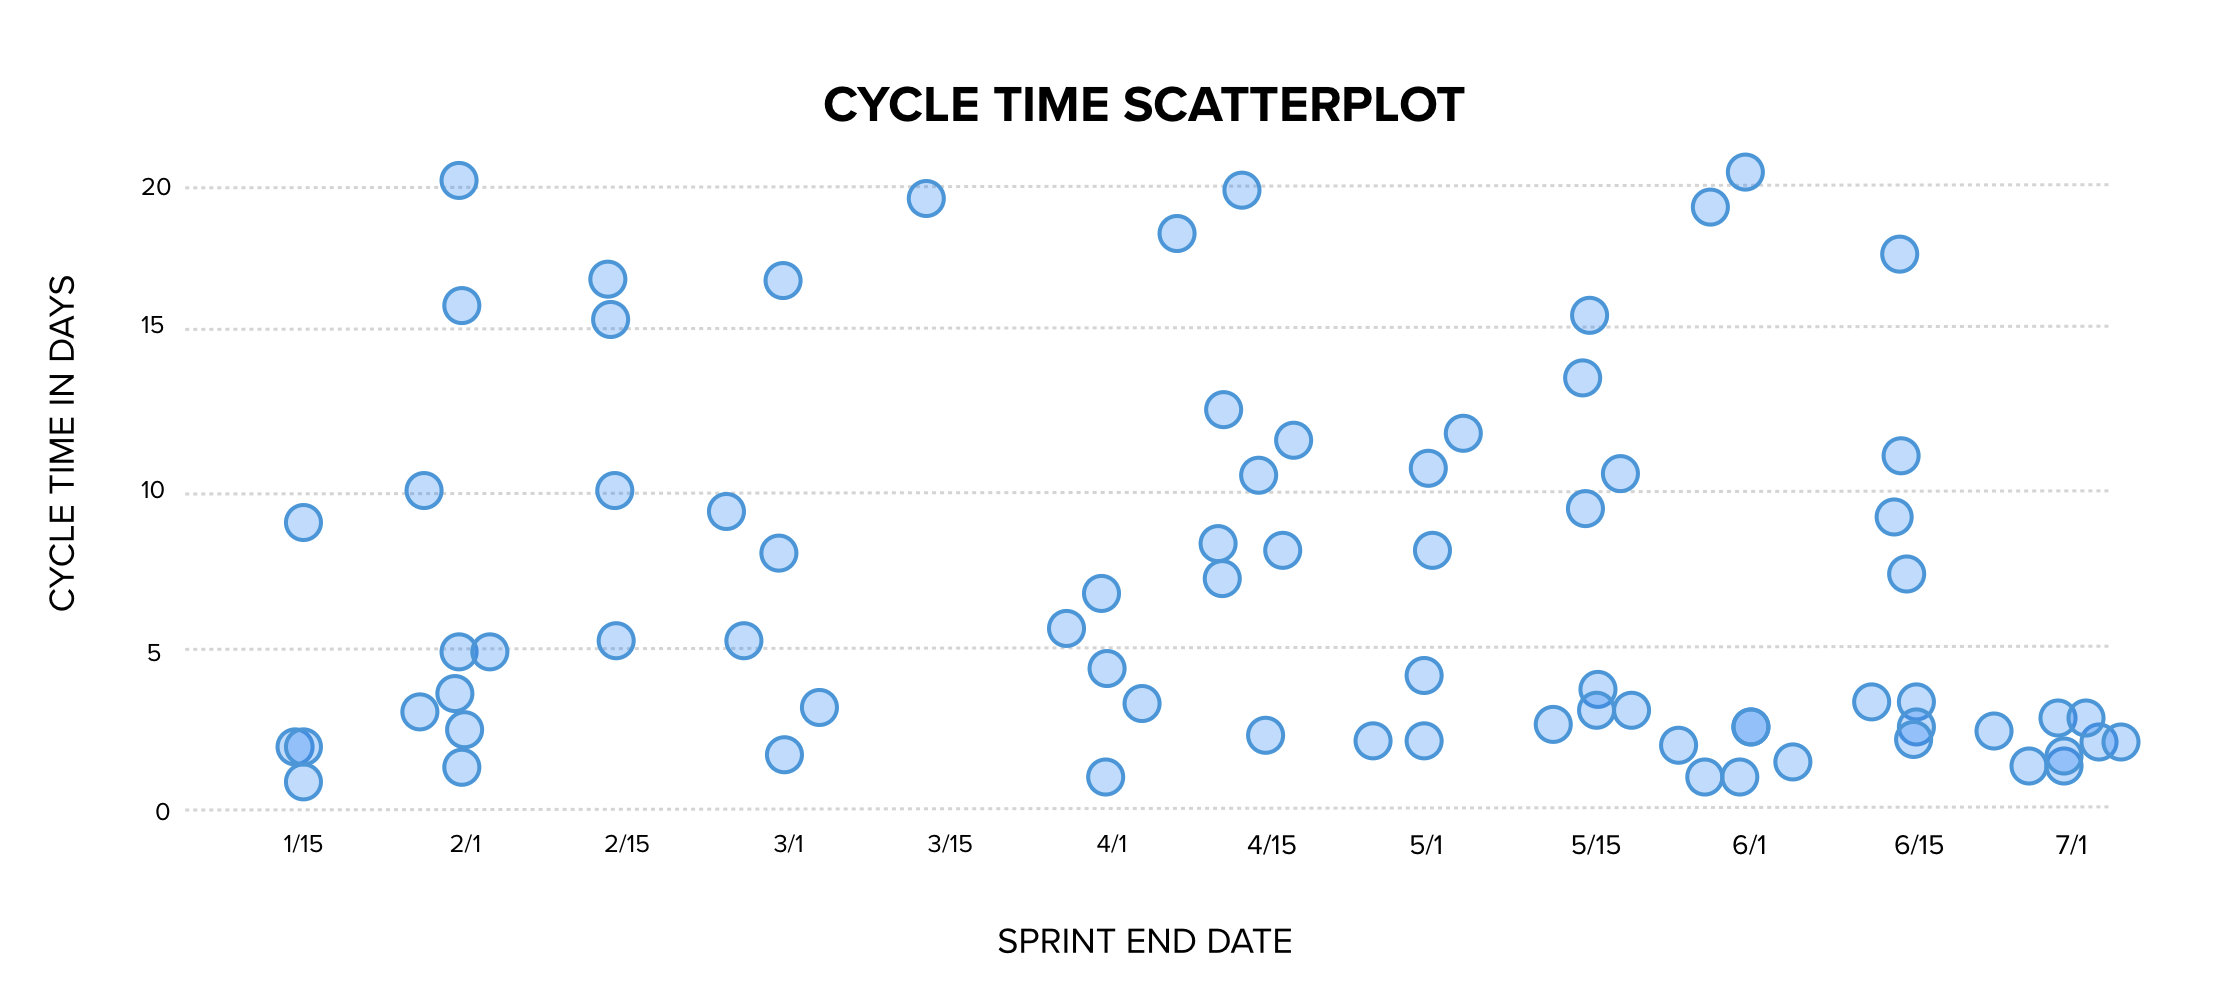
This chart provides predictability. We can now see historical data about how long it took to deliver each item. Rather than using guesses and treating them as though the guesses were all correct, we now have a collection of measurement data to which we can apply statistical analysis. This chart tells us that historically 95% of work items completed in 19 days or less.
Over time, estimates are not becoming more accurate. They are becoming more acceptable. Measure cycle time, throughput, and WIP. Estimating in story points, gathering velocity, and attempting analysis on the velocity to validate assumptions is circular reasoning. Velocity variance shows us only one thing: estimates are becoming more politically acceptable over time.
A final thought: What is the virtue of using a pseudoscientific system that looks like math and statistical analysis to improve estimation when estimation can be accomplished by simply adopting short iterations to reduce the scale of any variance between estimates and actuals and improve precision. Why spend money and time assigning points, building charts around points, and then analyzing the patterns in the charts when the team can simply be asked, “Can you get this done in 2-3 days? No? How can we make it smaller?”

References
Buehler, R., Griffin, D., & Ross, M. (1994). Exploring the planning fallacy: Why people underestimate their task completion times. Journal of Personality and Social Psychology, 67(3), 366-381. The paper that nails down a cognitive bias: The Planning Fallacy. The Planning Fallacy is that people will consistently underestimate how long it takes to perform a task. Estimates consistently skew toward optimism. Even in the face of evidence of the bias, estimates still skew to underestimation.
Deming, W. E. (1986). Out of the crisis. MIT Press. Source for the principle that a measurement requires an operational definition. Story points are not a valid measurement unit because they are completely subjective and subject to the Planning Fallacy.
Flyvbjerg, B. (2006). From Nobel Prize to project management: Getting risks right. Project Management Journal, 37(3), 5-15. Introduces the distinction between optimism bias and strategic misrepresentation (politics influencing estimates) and finds the latter dominates, supporting the argument that estimates converge on politically acceptable numbers rather than accurate ones.
Flyvbjerg, B., & Gardner, D. (2023). How big things get done. Currency. Generalizes the strategic misrepresentation finding across thousands of projects and provides accessible language for the political mechanism behind systematic estimation error.
Goodhart, C. A. E. (1975). Problems of monetary management: The U.K. experience. In Papers in monetary economics. Reserve Bank of Australia. Original source for what became Goodhart’s Law, which is a kind of observer effect that happens when you start measuring people and work. If they know they are measured, they modify their behavior to change the measure to the positive, even if it makes the results worse. Story points are nearly the worst case on every dimension. The number is invented by the team members, and it corresponds to nothing in the real world. They can make the number anything they want. When work is completed, the estimate is not trued up, and any variance stands. The original estimate is treated as correct. This is literally the worst case scenario for a useless data point.
Jørgensen, M., & Sjøberg, D. I. K. (2004). The impact of customer expectation on software development effort estimates. International Journal of Project Management, 22(4), 317-325. Telling estimators what the customer hopes to hear pulls the estimate toward that number.
Jørgensen, M., Teigen, K. H., & Moløkken, K. (2004). Better sure than safe? Over-confidence in judgement based software development effort prediction intervals. Journal of Systems and Software, 70(1-2), 79-93. Reports that 90% confidence intervals around software effort estimates contain the actual outcome only 60-70% of the time. Estimates are not as accurate as our confidence in them suggests.
Moløkken-Østvold, K., & Jørgensen, M. (2003). A review of surveys on software effort estimation. Proceedings of the International Symposium on Empirical Software Engineering, 223-230. Synthesis across multiple surveys finding that 60-80% of software projects encounter effort or schedule overruns with a mean overrun of 30-40% showing bias in software estimates with large impacts to planning.
Reinertsen, D. G. (2009). The principles of product development flow: Second generation lean product development. Celeritas. Source for the argument that economic decisions in product development should be based on observable quantities such as cycle time and throughput rather than on uncalibrated estimates, and for the batch-size principles that justify the “few days” forcing function.
Tversky, A., & Kahneman, D. (1974). Judgment under uncertainty: Heuristics and biases. Science, 185(4157), 1124-1131. Foundational paper on cognitive biases including anchoring Group estimation techniques like planning poker produce correlated rather than independent errors due to anchoring bias.