It is counterintuitive that increasing the number of work items in progress will slow down productivity. In order to help explain this idea, I created a simulation that runs two different systems with different WIP limits side by side. After running the simulation, it is obvious that the more disciplined system with the lower WIP limit produces more output while providing faster cycle times. The results of this simulation will hopefully encourage teams and leaders adopt WIP limits to improve cycle time as a strategy over maximizing resource utilization to increase throughput.
Assumptions
The simulation is based on Little’s Law [L=λW], the model that describes how work-in-process, cycle time, and throughput are related to each other in a stable system. When WIP is constrained, cycle time reduces if throughput remains constant.

However, because software development is subject to high variability (interruptions, changes, outages, and other inevitable problems), it is also necessarily to base the simulation on Kingman’s Approximation:
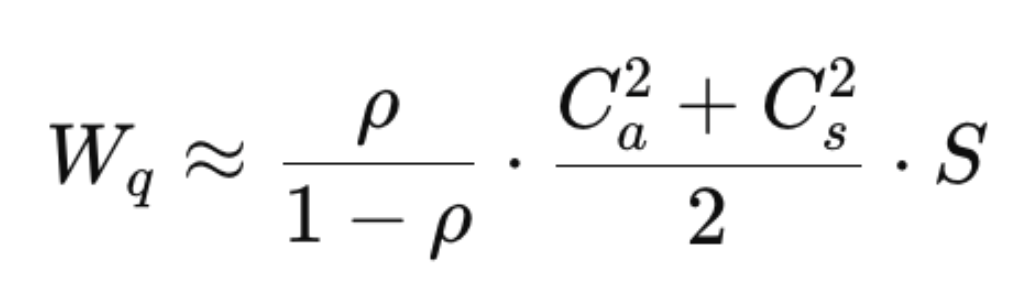
Kingman’s approximation shows that wait time, a component of cycle time, is affected by variability the more utilized a system becomes. The longer the cycle time of an item, the higher the probability it will encounter variability. Slower moving systems, such as a system that maximizes utilization in favor of efficiency and maximizing throughput, will ultimately see lower throughput because of the high cycle times and long life of work-in-process.
The Simulation
The simulation runs two identical kanban boards for sixty seconds. The board on top has work-in-process (WIP) set at a maximum of nine items per column. Each column has three workers. The goal of the WIP=9 system is to keep every fully utilized and busy. Nine cards per column means every worker always has something to pick up.
The board on the bottom has WIP set to a maximum of two items per column. Each column also has three workers. Two cards per column means workers sometimes stand idle. Instead of worrying about the busyness of the workers, instead the lower WIP limit is used to create availability when variability occurs.
Both boards have the same four work stages (Design, Dev, Review, QA), the same three workers per stage, the same arrival rate, and the same variability profile (cv² = 1.5). The only difference is the work-in-progress limit: nine cards per column on the top board versus three on the bottom.
Both boards are pre-seeded with work to allow the simulation to run in only 60 seconds and save the reader time and lower the size of the simulation file.
The simulation asks a simple question: which board delivers more finished features?
The Simulation in Action
The answer is consistent and unambiguous.
The board with where WIP=2 delivers has a higher probability of more throughput with less cycle time, despite having idle workers visible at any given moment.
The board with a WIP=9 looks busier — every column packed, every worker occupied — but its output is statistically lower and its features take longer to arrive.
The visual tells the story immediately: the top board fills with pulsing red blocked cards while new work piles up behind them. The bottom board has visible gaps in its columns. Those gaps are availability, and they are why it works.
How it Works
The overloaded board is suffering from three effects:
- Context switching. When a column holds nine cards but only three workers, each worker juggles three items simultaneously. Every additional card beyond the worker count imposes coordination overhead. Each worker is now responsible for compounding status updates, mental context loading, merge conflicts, interrupted focus. The simulation models this as a twelve percent slowdown per excess card, which means a full column of nine runs at 1.72x slower than a column of three.
- Variability increasing due to work item age. Every feature in-process has a probability to become impacted by variability. Features that spend more time in the system are more likely to encounter impediments. Requirements drift, dependencies shift, the engineer who started the work gets reassigned, and branches diverge. The simulation models this as a block probability that starts at two percent per handoff and increases by 1.2 percent for every second the card has been in the pipeline. Cards on the overloaded board age faster because they are processed slower, which makes them more likely to block, which makes them age even faster. This is the vicious cycle that Kingman's formula predicts but understates, because Kingman assumes service time is independent of queue depth. In software, it is not.
- Swarming. When a card blocks on the WIP=2 board, idle workers have capacity to help resolve the impediment. When a card blocks on the overloaded board, every worker is already juggling three other items and the blocker simply sits. This effect is magnified in an environment with functional silos. Workers on the same team may not swarm, because they are overloaded, so requests to help go to other fully utilized workers and end up in queues waiting for attention.
Little's Law
Little's Law explains some of this: work in progress equals throughput multiplied by cycle time. Both boards have the same throughput capacity, but the overloaded board carries three times the WIP. Little's Law requires that this additional inventory show up somewhere, and it shows up as tripled cycle time.
Every feature on the WIP=9 board takes three times longer to reach a customer, which means three times longer before the organization learns whether the feature was worth building, three times more opportunity for the work to become obsolete, three times more carrying cost in the form of stale branches, forgotten context, and coordination overhead, and three times the vulnerability to being interrupted when company leadership changes priorities.
The Clean Winner: WIP=2
The most counterintuitive finding is that the WIP=2 board does not sacrifice throughput for speed. It achieves both. The reason is that "keeping everyone busy" is not the same as "being productive." A worker juggling nine cards while three of them are blocked and two have drifted requirements is busy but not productive. A worker focused on a single card that flows through to completion in ten seconds is idle between cards but enormously productive. The simulation makes visible that the WIP=9 board sacrifices productivity for busyness while the WIP=2 board sacrifices busyness for productivity.

Notes 2026-03-16:
- Simulation was updated to reduce the WIP of the lower board to 2 from 3. The article was updated with references to WIP=2. Since there were three workers per team, a WIP limit of 3 was still a fully utilized system.
- Variability application was modified so that it only applied to active work. If no worker was working on an item, applying variability did not cause negative effects of task switching.
- The done column now counts properly. Previously, it was counting only items that moved from the backlog. The pre-seeded items were not being counted because variability was applied at handoff, so the top chart looked like it was faster due to low/no variability during a 1 minute simulation. After running for several minutes the simulation would reveal the problem, but it was assumed the reader did not wish to stare at it for an extended time.
- Cosmetic improvements such as fonts, colors, etc.
- Added the ability to restart the entire simulation after it completes to reduce page loads and scrolling problems. The simulation is stochastic, so each replay provides different results based on probability.
- Removed the item aging coloring. It was not useful for comparing WIP models and utilization.