In 1999, an Extreme Programming team at Chrysler was working on the C3 project. Management requested delivery commitments based on time estimates. To allow planning without turning estimates into promises, team member Ron Jeffries introduced relative estimation, later known as story points.
Story points attempt to forecast delivery using estimated effort, but software delivery time is dominated by system delay rather than effort. Because of this mismatch, story points cannot provide predictability.
What was intended as a local planning heuristic became seen as a predictive scheduling instrument.
Do Story Points Do What is Claimed?
Story points are used to answer a forecasting question: how much scope can be completed by a date, or how long a set of work will take. Teams estimate each work item based on perceived effort, sum completed points into a measure called velocity, and use that historical velocity to predict future completion.
How the method works: estimated effort → velocity → delivery forecast. For this method to work, the duration of work must be primarily determined by effort.
System Effects Dominate Delivery Time
When a work item moves through a development system, its elapsed time consists of two parts: the time someone is actively working on it and the time it spends waiting between steps.
Delivery time can therefore be described as:
Delivery Time = Touch Time + Wait Time
Consider the figure below. The item waits in a backlog, is worked on in design, waits again before coding, waits again before testing, and finally waits for release. Across the entire path, eleven days are spent doing work while twenty-one days are spent waiting. The total delivery time is thirty-two days.
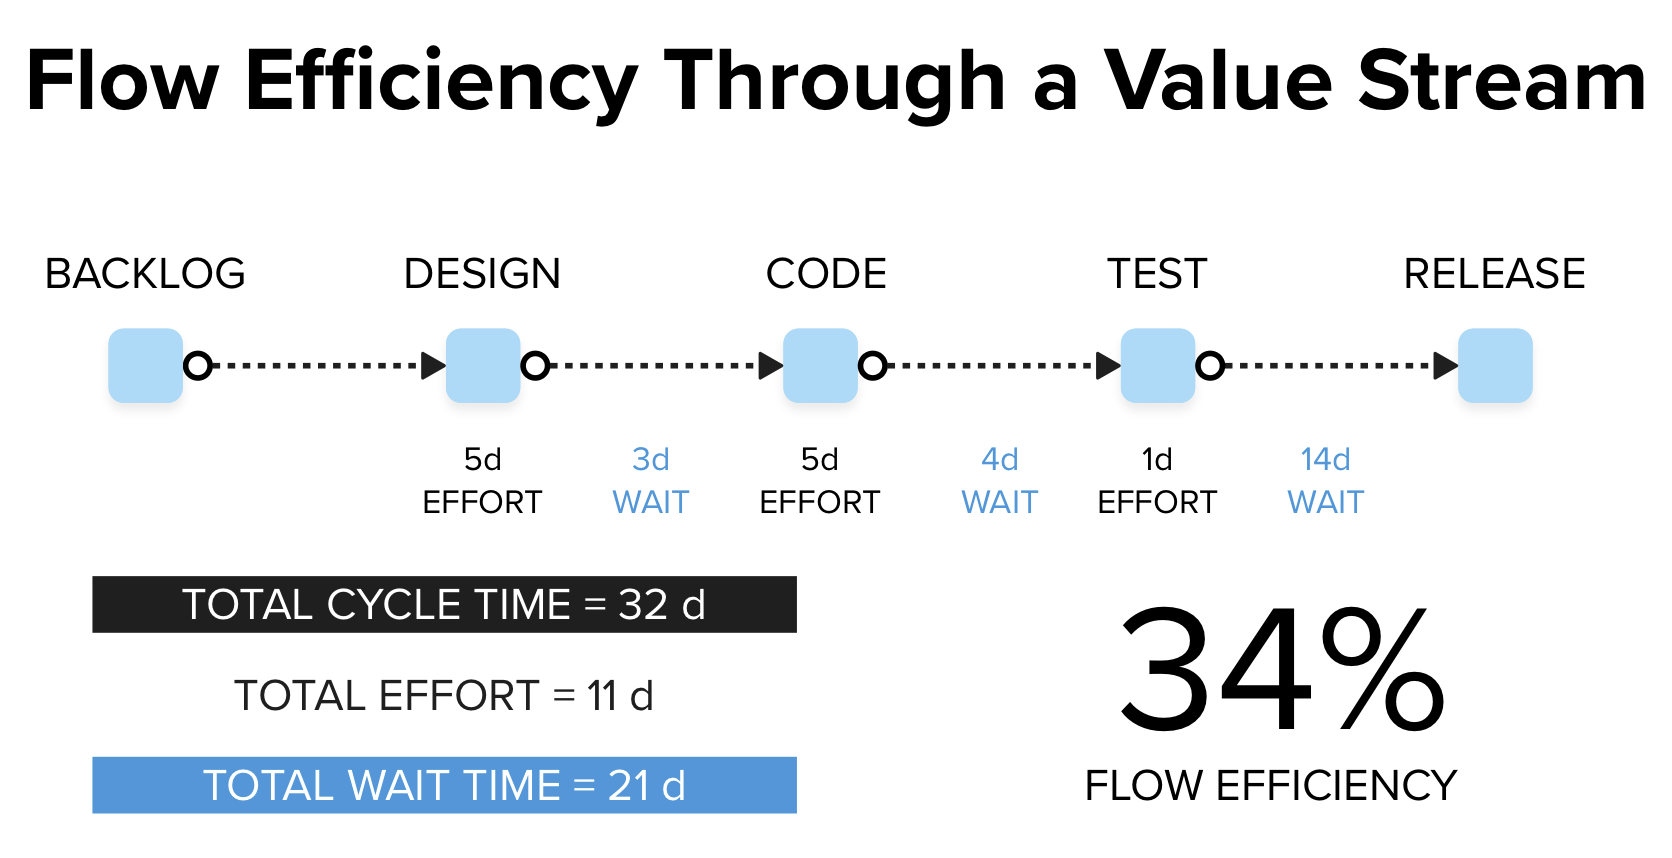
Most of the elapsed time is not effort but delay between activities.
Because completion time is dominated by waiting rather than effort, estimating effort cannot determine how long the work will take.
Velocity
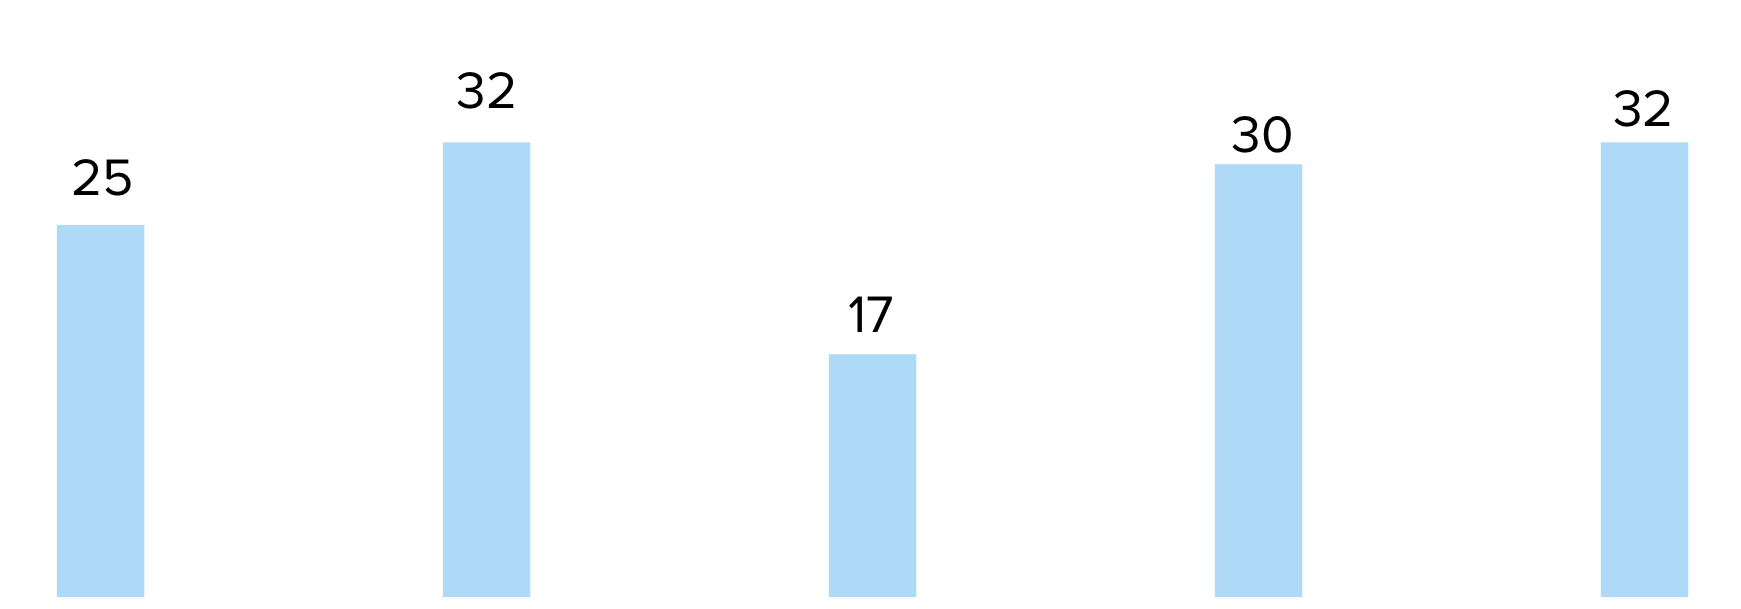
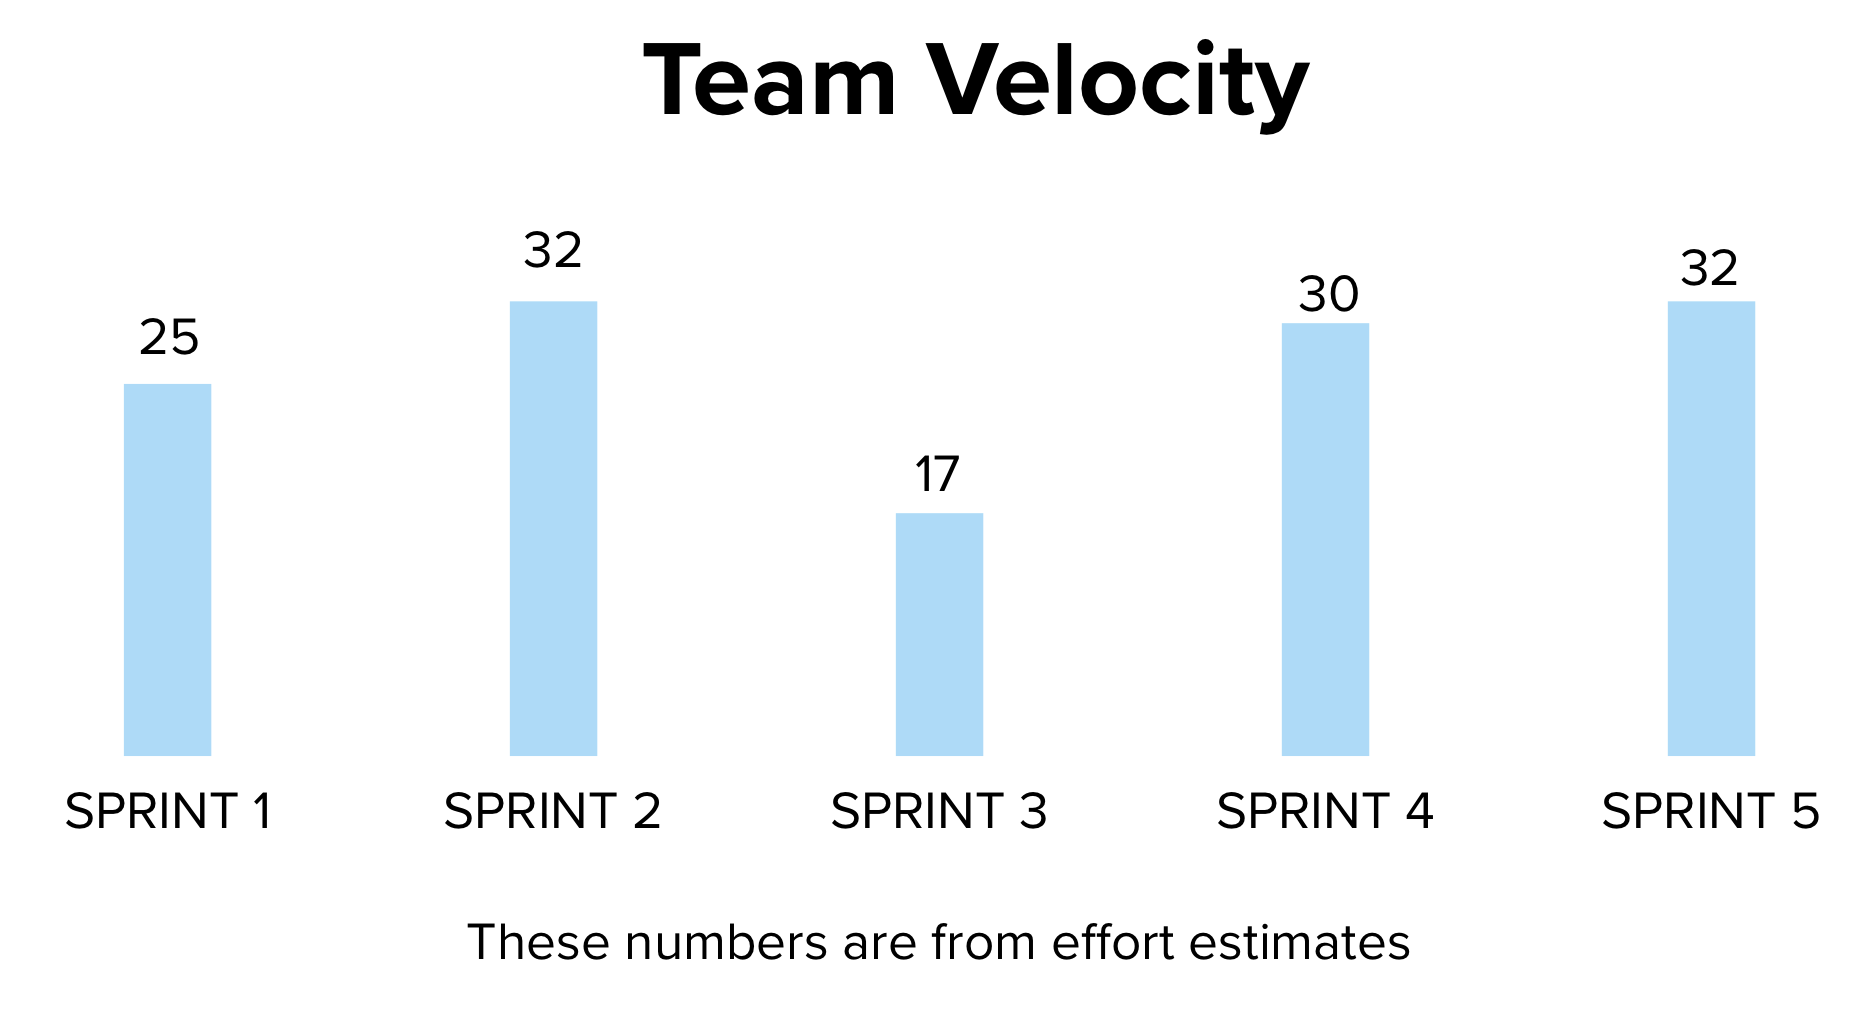
Velocity is the sum of estimated effort completed in previous sprints. The graphic below shows five sprints of recorded velocity, with an average of 27.2 points. This value is commonly used to forecast how much work a team can complete in future iterations.
However, velocity is derived entirely from effort estimates. In the previous section we established that effort does not determine delivery time because most elapsed time is waiting. As a result, velocity aggregates a quantity that does not control completion time.
A forecast based on velocity therefore cannot reliably predict when work will finish or how much scope will be completed by a date.
Velocity is a Collection of Estimates
Teams often observe that their sprint forecasts become consistent over time. This does not occur because estimation becomes accurate, but because teams learn what size of work can be completed within the iteration and select items accordingly.
Once work selection stabilizes, the recorded velocity stabilizes as well. The points reflect the decision rather than guiding it.
The charts below illustrate this effect: completion time varies independently of assigned story points. The team finishes work consistently not because the estimates predict duration, but because the size of work being attempted has become consistent.
Predictability therefore comes from controlling work size and limiting variability, not from estimating effort.
Comparing Story Points to Cycle Time
The chart on the left compares assigned story points to the actual cycle time of completed work. Each vertical grouping represents items given the same estimate.
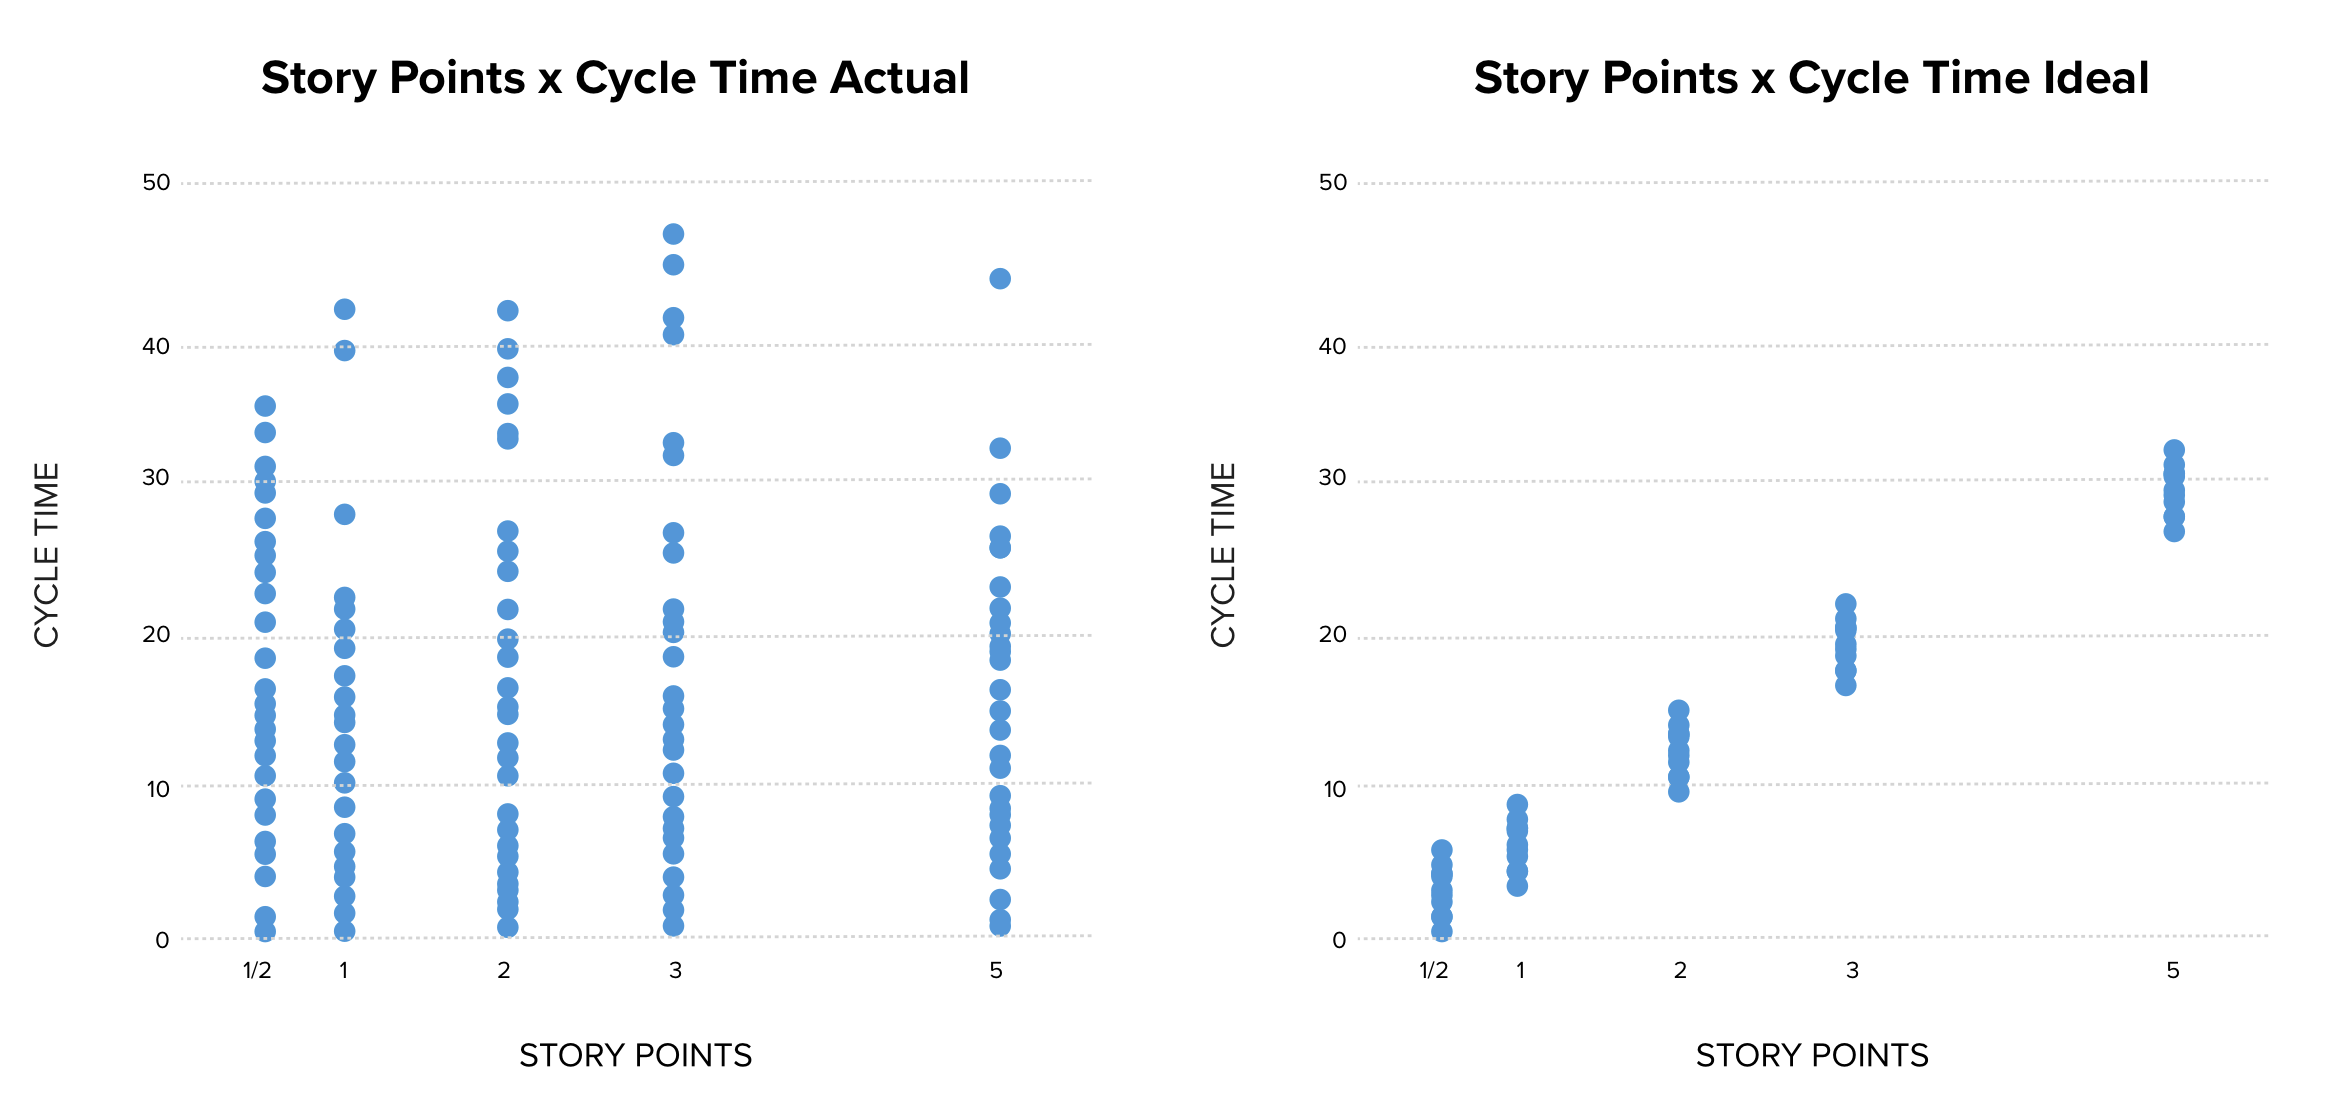
If story points determined how long work takes, items with the same estimate would complete in similar durations and larger estimates would consistently take longer. The chart on the right illustrates what that pattern would look like.
Instead, completion times vary widely within each estimate category. This occurs because story points describe perceived effort, while completion time is largely governed by waiting and workflow effects. The estimate and the duration are therefore not measuring the same property
Teams experience consistency because they learn how much work fits and adjust selection. The estimates stabilize afterward, so the numbers appear predictive even though they are only describing a stable workflow.
The Economic Cost
Improving the precision of story point estimation does not improve forecasting. Delivery time depends on many factors, while story points measure only estimated effort. Because effort does not determine completion time, increasing estimation accuracy cannot increase schedule accuracy.
Time spent learning the scale, recording velocity, debating point values, and reconciling estimation differences therefore does not influence delivery predictability. It consumes capacity while leaving the outcome unchanged.
Someone is Going to do the Math
Planning requires relating scope to time and cost. When story points are used to forecast how much work fits into a fixed time period, they implicitly define a rate of points per unit time.
Once such a rate exists, time and cost can be derived from it. For example:
A sprint contains 80 working hours per person
A team has 10 people
The team completes 40 points per sprint
80 hours × 10 people = 800 hours per sprint
800 hours ÷ 40 points = 20 hours per point
20 hours × $75/hour = $1500 per point
The unit has changed, but the underlying estimate has not. Story points therefore do not prevent conversion into schedule or budget; they introduce an additional translation step.
Evidence-Based Forecasting
Predictability improves when forecasts are based on observed delivery behavior rather than estimated effort. Cycle time and throughput measure how long completed work actually took, including both active work and waiting within the workflow. These measurements therefore reflect the full set of factors that determine completion time.
Because they record completed outcomes, past cycle times can be used to infer future durations. Statistical modeling can then produce date ranges and confidence levels for finishing a body of work, or the amount of work likely to be completed by a given date.
Forecast accuracy improves because the prediction is derived from the same variable it is attempting to predict: elapsed completion time.
Summary
Story points are intended to predict how much scope can be completed in an iteration, or by what date a set of scope can be completed. They measure effort, but effort does not control the delivery time teams are attempting to predict. Velocity measures are therefore totals of estimates rather than records of delivery time, and it remains possible to convert story point forecasts into hour and money estimates anyway. Measuring duration instead of estimating effort provides the predictability businesses are actually seeking.