
When we make plans, we assume the future will behave roughly the way the past did. Variability is the degree to which that assumption breaks down.
In simple terms, variability is the difference between what we expect to happen and what actually happens.
More precisely, variability is the spread of outcomes around an average. Anything in the system that occurs irregularly and unpredictably exhibits variability.
Suppose your average cycle time is five days. That number alone tells you very little. If most items finish between four and six days, the system is relatively stable and predictable. If some items finish in two days and others take twenty, the average is still five, but the system behaves very differently. That spread is variability.
This is the flaw of averages: two systems can share the same average and produce very different planning outcomes.
Statistically, this spread can be described using measures such as standard deviation and percentiles. Standard deviation measures how far observations tend to deviate from the mean. Percentiles answer a more practical question: “What percentage of work finishes within a given time?” For example, saying that 85 percent of items complete within twelve days is often more useful for planning than quoting the average.
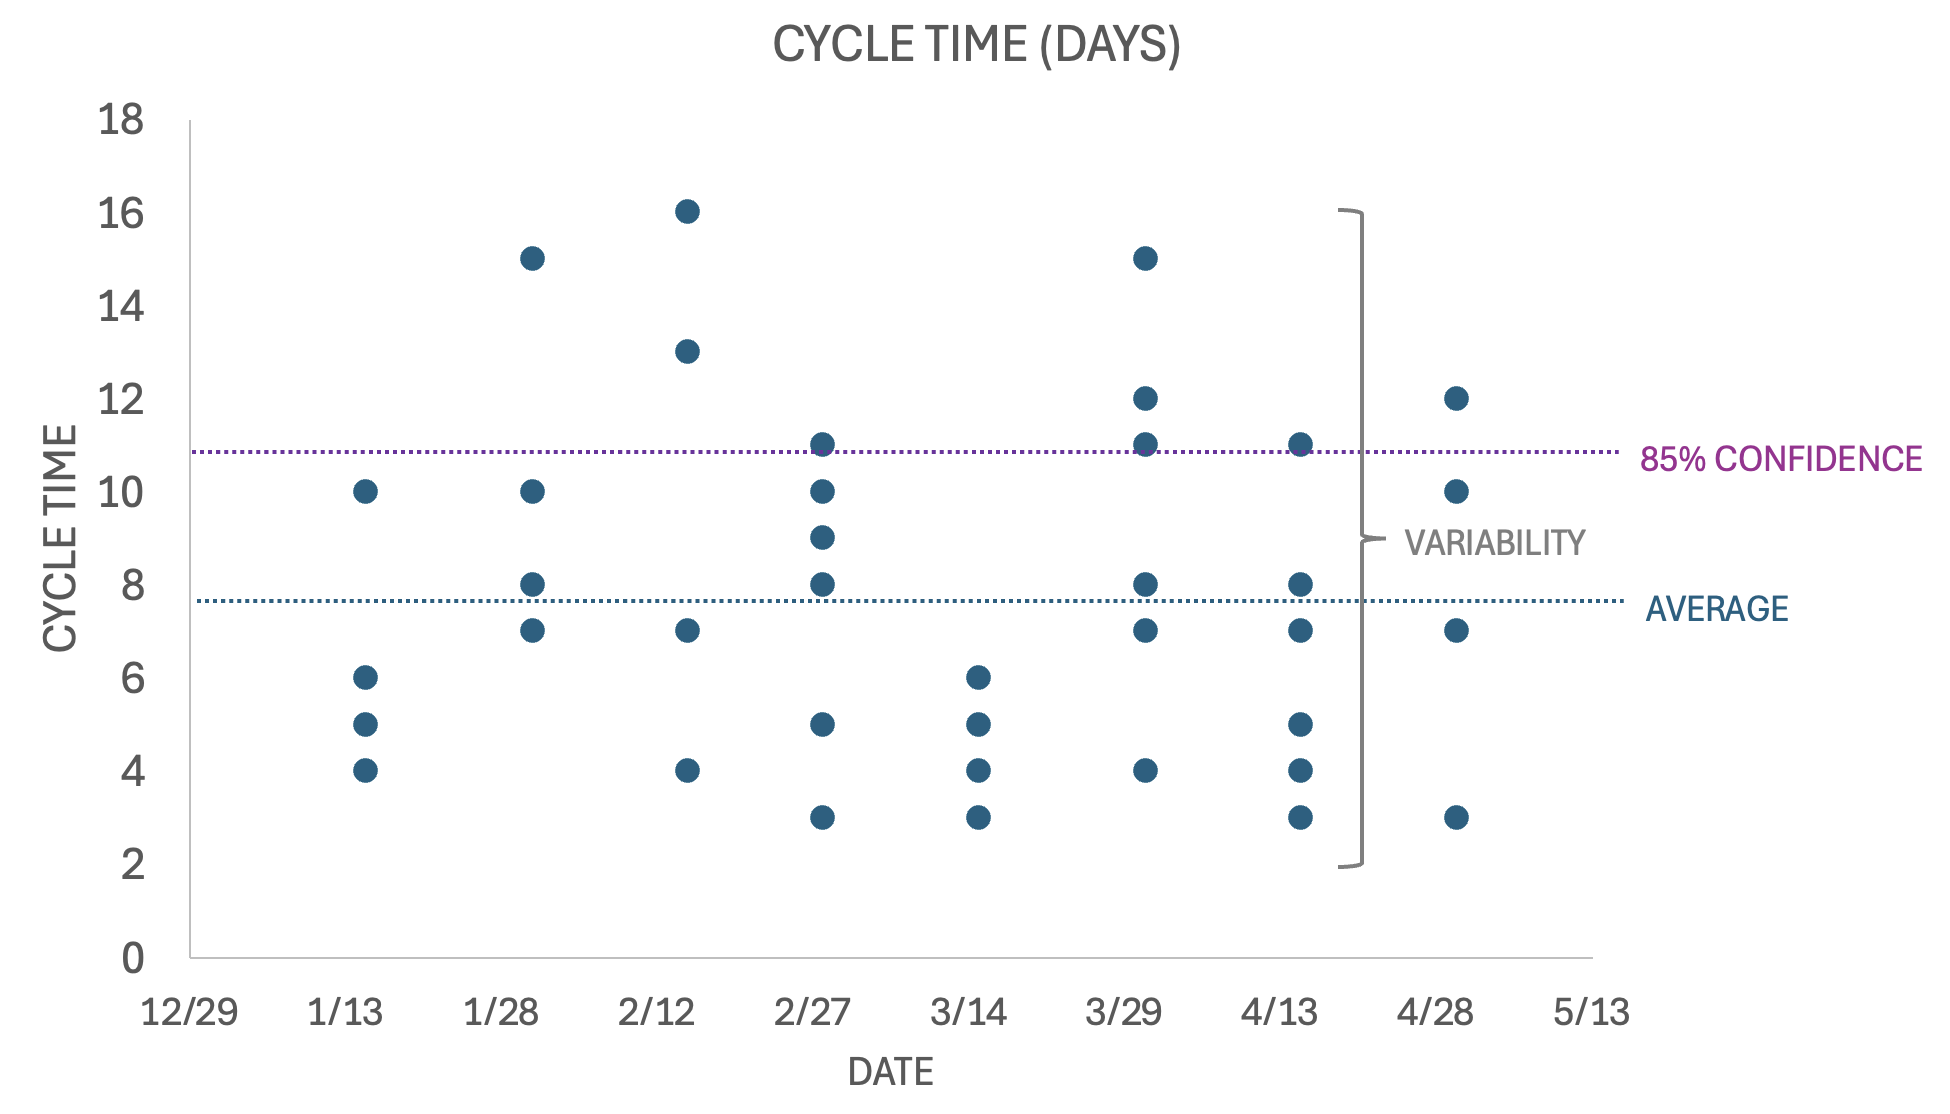
Look at the chart above.
Each dot is a completed work item. The dotted blue line shows the average cycle time. The purple line shows the 85 percent probability that any item will complete that fast or faster. The vertical bracket shows the the spread between the fastest and slowest outcomes.
That spread is variability.
If all of the dots were clustered tightly around the average, planning would be more straightforward. When the dots are scattered from three days to sixteen days, outcomes becomes uncertain even though the average remains stable.
Software delivery data is rarely normally distributed. Cycle times tend to be right-skewed: many small items and a few very large ones. Those large items stretch the tail and create planning risk. In that environment, percentiles usually provide clearer guidance than the mean alone.
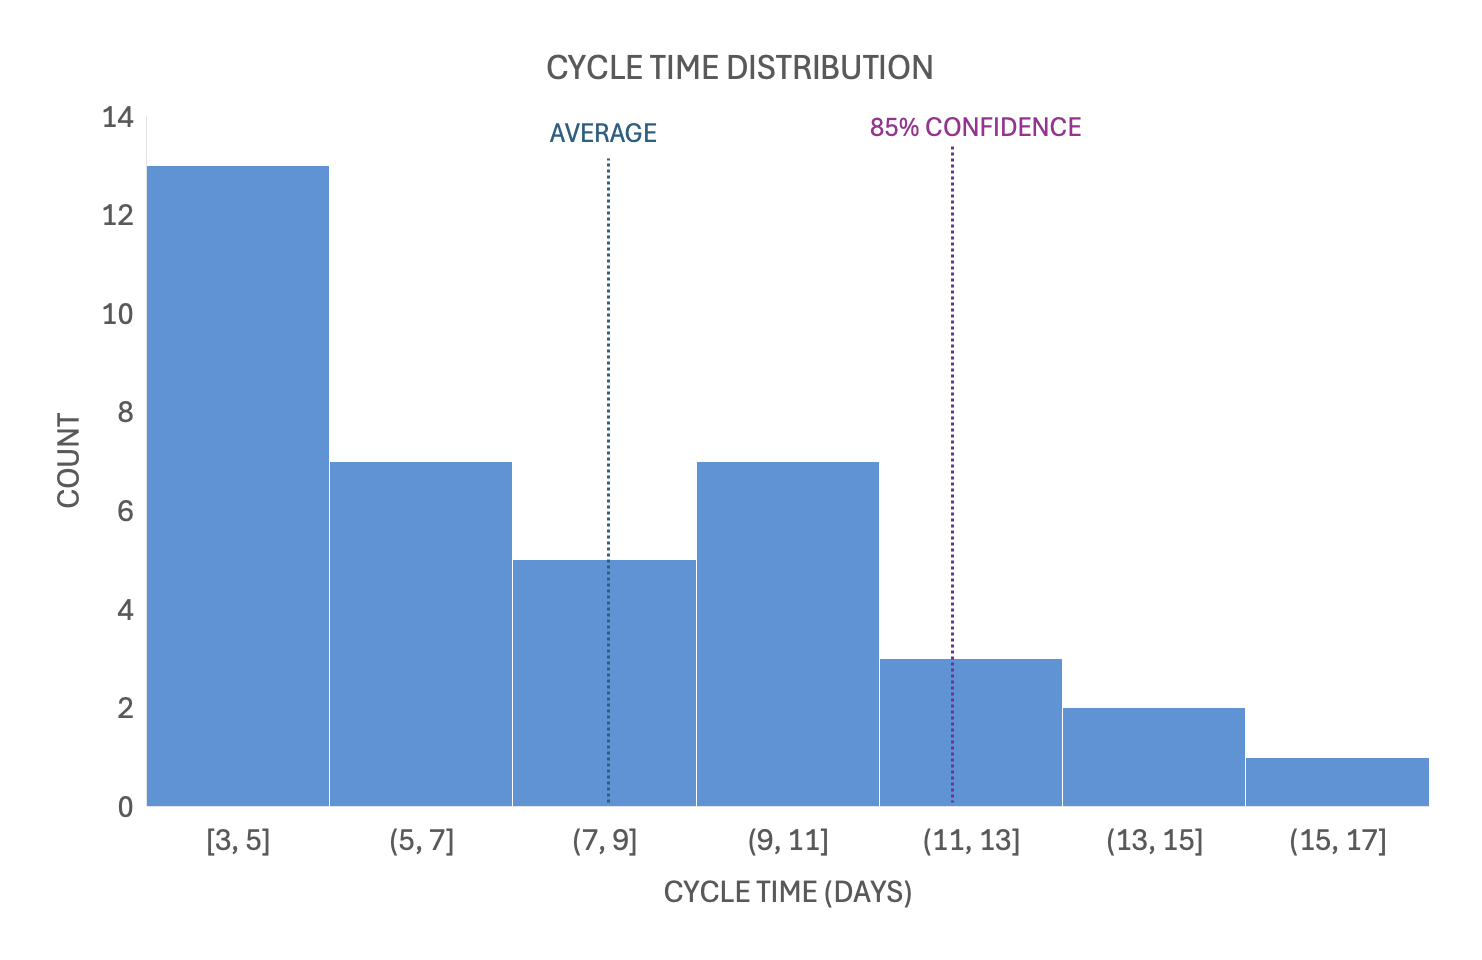
The Cycle Time Distribution chart reinforces this point. Cycle times skew toward lower values on the left and there is a long tail out to the right. Software development cycle times are usually distributed this way. The average is visibly not informative for predictability. The 85th percentile provides a more realistic indicator of likely future cycle time.
Variability is not a management failure or a team problem. It is an ever-present property of changing environments. Variability always exists.
When building software, there is a high probability that something surprising will happen. Surprises are terrible for planning. Surprises are called variability. There is considerable variability in the work of building software that tends to manifest in specific ways to make creating estimates or plans very difficult. In this article, I will cover some examples variability and cover some techniques that help reduce or manage it.
Variability and Flow
Variability increases queue lengths and cycle times, widens forecast ranges, reduces predictability, and increases the cost of delay.
Queue lengths increase when work arrives or completes at uneven rates. Random fluctuations mean that, at times, more work will arrive than the system can process. Those temporary imbalances create waiting, and waiting creates queues.
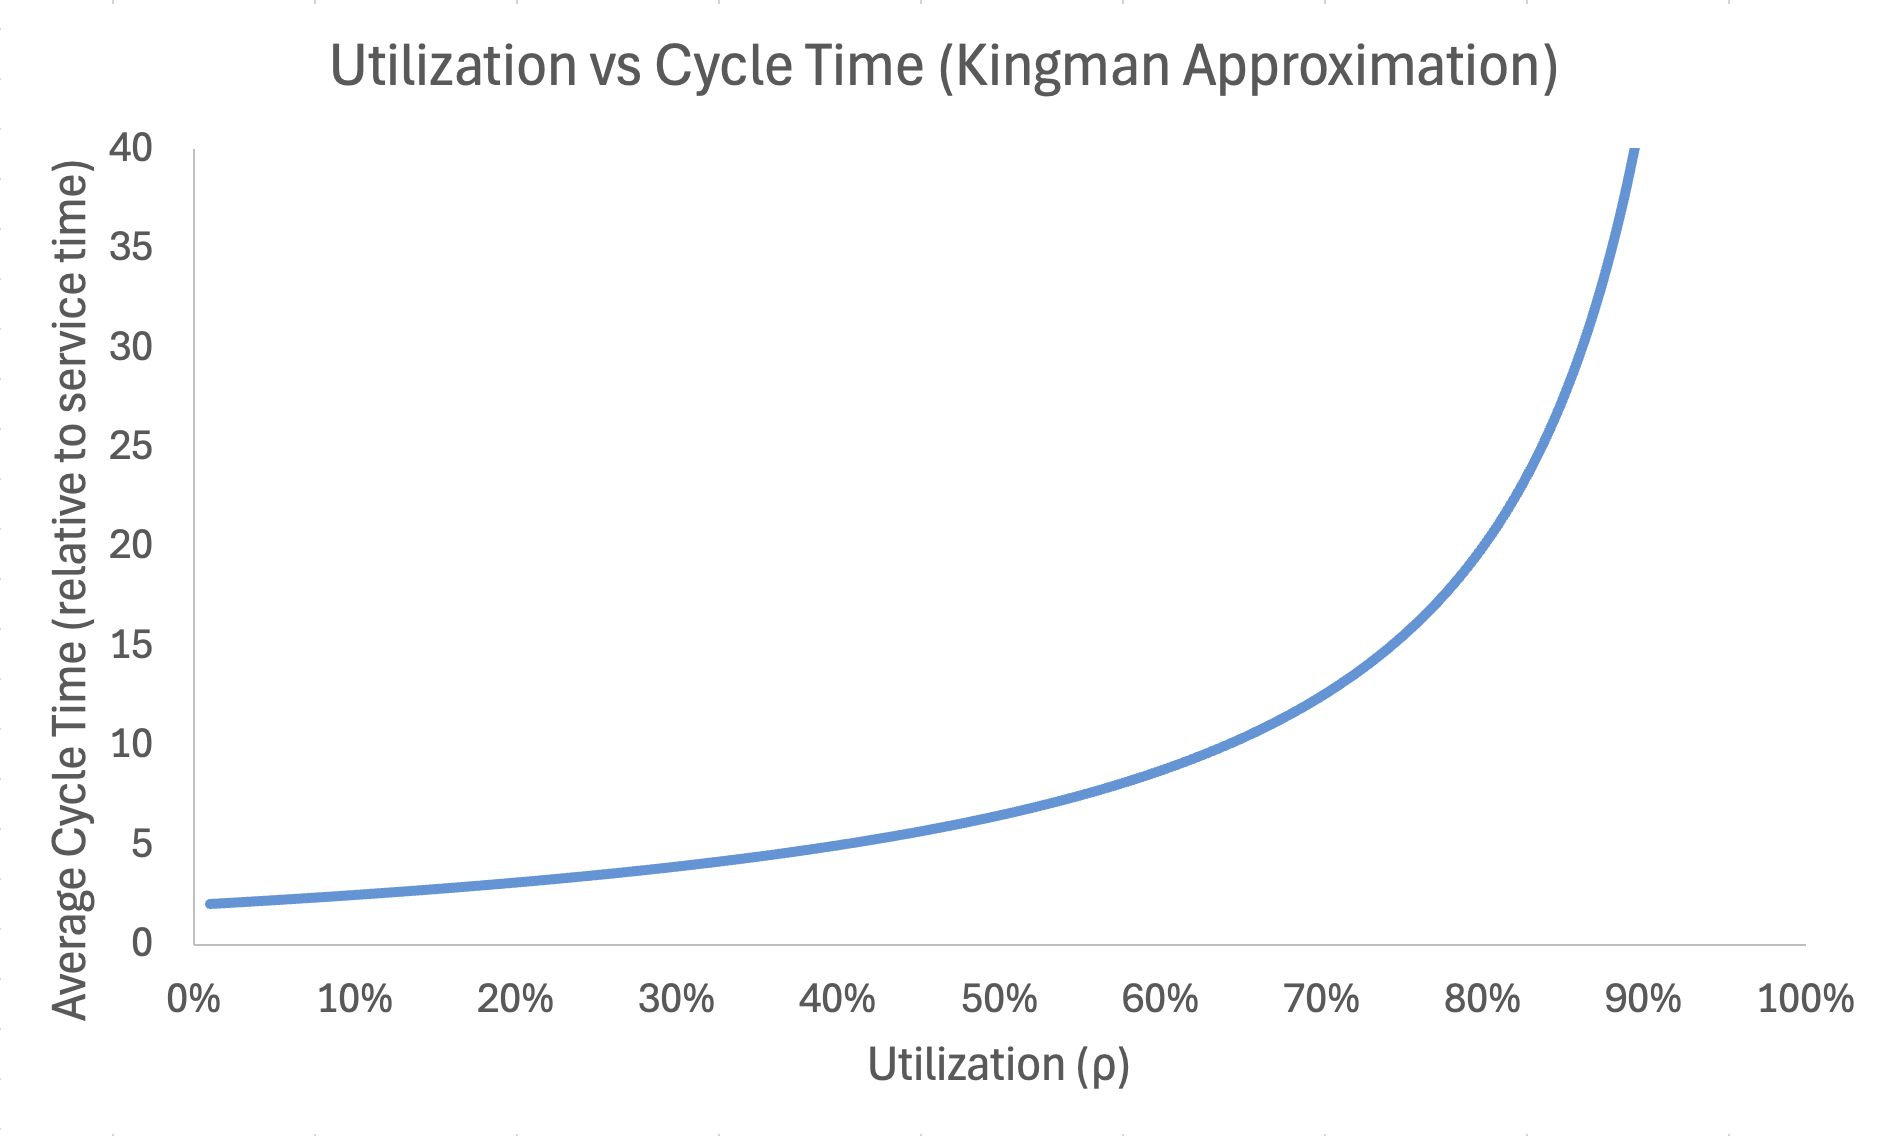
As utilization approaches capacity, wait times grow nonlinearly. The chart above demonstrates cycle time acceleration as utilization increases. Controlling utilization through WIP constraints does not reduce variability. It reduces the impact of variability on flow. The greater the variability in arrivals or service time, the steeper this curve becomes.
Cycle Time = Wait Time + Service Time. As wait times increase, cycle times increase with them. Longer wait times increase cost of delay because items sit idle in the system.
Forecast ranges widen, reducing predictability, when completion times are widely dispersed.
Even if average arrival rate equals average processing rate, variability ensures temporary overload.
Sources of Variability
External
- Environmental – The economy can surge or contract, affecting planning assumptions. Markets can shift when competitors introduce disruptive products. Physical or regulatory events can alter operating conditions. Any external force that changes the environment in which the team operates is environmental variability.
- Technology – Applications, operating systems, hardware, and platforms can fail, change, or require updates that alter expected behavior.
- Disruption – Any new, unexpected behavior by a competitor can change the performance of products and services in the marketplace.
Internal
- Arrival rate – Requests rarely arrive evenly in software development. They tend to be random or bursty. Seasonal campaigns and annual marketing announcements cause spikes in demand. Budget cycles, such as year-end depletion and first-quarter replenishment, create additional bursts of activity.
- Scope – Customers may reject or reprioritize recent work, requiring a shift in direction. Competitors may introduce features that force rapid response. Leadership priorities may change, altering what work is considered most valuable.
- Schedule – Delivery dates may change due to shifting client or organizational constraints. Work may prove more complex than initially understood. Issues discovered during execution can make original delivery forecasts inaccurate.
- Service time – The estimated effort required for a work item may differ significantly from actual effort. The complexity of work is often not fully understood until execution begins. Empirical systems address this by using short feedback loops to discover complexity through delivery.
- Cross-team dependencies – Teams often attempt to identify all dependencies before beginning work. In complex systems, many dependencies remain hidden and are only discovered during execution. Interactions between teams introduce coordination delays and feedback loops that amplify variability.
Variability and VUCA
Variability increases in environments characterized by VUCA.
- Volatility – things change, and the pace of change is increasing.
- Uncertainty – we cannot see the future, and the farther into the future we try to predict, the less accurate our predictions.
- Complexity – systems are interconnected in ways that are not fully visible until work begins.
- Ambiguity – situations can be interpreted in multiple ways, and signals are not always clear.
These conditions increase the dispersion of outcomes and therefore increase variability. Software development is a high VUCA environment. VUCA is often reduced to “uncertainty,” but the term encompasses volatility, complexity, and ambiguity as well.
Ineffective Responses to Variability
Organizations often adopt practices intended to control variability without explicitly identifying it.
Documentation – Listing assumptions and potential risks and planning responses in advance is a common attempt to control uncertainty. While this may clarify thinking, it does not eliminate the dispersion of outcomes. Extensive documentation can also increase plan complexity, making plans harder to maintain as conditions change.
Extra Planning – When variability is encountered, it is sometimes treated as a planning failure. This can lead to demands for more detailed plans created further in advance. While planning can clarify intent, it cannot eliminate uncertainty. Larger, more detailed plans often aggregate more scope and extend exposure over longer time horizons. Increased exposure amplifies the impact of variability.
Effective Responses to Variability
Respond to variability with by managing flow:
- Small batch work – Smaller batches reduce cycle time and therefore reduce exposure to variability. Shorter work items, smaller plans, and shorter cycles limit the magnitude of variability’s impact.
- WIP constraints – Limiting the number of items in progress reduces queue amplification. High WIP does not create variability, but it magnifies its effects by increasing waiting time and congestion. Lower WIP reduces the cost of fluctuation.
- Short planning horizons – The farther into the future a plan extends, the more scope tends to aggregate into larger batches. Larger batches increase coordination complexity and extend exposure time. Longer exposure amplifies the impact of variability and increases the likelihood of delay.
- Decentralization – Delegating decision authority to teams reduces response latency. When variability occurs, faster local decision-making limits delay and reduces cascading effects.
The practical response to variability is to work in small increments on a limited number of items at a time. Frameworks such as Scrum and XP introduce iterations to encourage small batches and constrained WIP. A short, fixed cadence creates conditions that expose oversized work and excessive batching.
For example, when a Scrum team begins a backlog item at the start of a sprint and does not complete it by the end, the iteration has exposed excessive batch size. Work that cannot fit within the timebox is too large. The team must consciously decompose it into smaller units. Iteration alone does not enforce small batches; it makes oversized work visible.
Underlying Assumptions About Planning and Variability
Many software organizations assume that extending planning horizons will reduce uncertainty and improve delivery speed. In practice, longer-range planning often increases exposure to variability rather than reducing it. While addressing bottlenecks can improve flow, the gains are typically incremental. Structural changes such as reducing batch size, shortening planning horizons, and limiting WIP tend to produce larger improvements in time to market.
If organizational leaders assume that:
- More planning will eliminate uncertainty
- Starting work sooner will help us finish it faster
- Starting more things and working overtime will help us deliver more
Improvements in time to market will remain limited, because these assumptions discourage reducing batch size, shortening planning horizons, and limiting WIP. When implemented consistently, those structural changes produce substantial gains in delivery speed.
Ultimately, the underlying assumptions held by leaders and teams determine whether time to market improves and whether variability is effectively managed.

Last updated: 2026-02-22