Across the business world, people measure things and review charts, graphs, and dashboards of those measures. Too often the measurements we take are counting things in a way that does not help us make decisions. Collecting data and then visualizing it should create transparency that helps with decision making. One of the most powerful things you can measure is a cycle time.
Definition of Cycle Time
Any stopwatch timing of an activity from start to finish is a cycle time. In manufacturing, cycle time is traditionally used to measure how long it takes for work to be completed from the time work begins until the time work is complete. However, using a stopwatch on activity from any start point to any end point can be incredibly informative:
- From request made to work begins
- From we had an idea to customer holding something in their hands
- From we learned something from customer use to we put a change in the customer’s hands
- From we sent a feature off to be tested to feature testing was completed
- From we had a defect discovered to we repaired the defect and are confirmed back up
- From we pitched to the client to the client signed the contract
- From I sent the contract upstairs for approval to the contract was approved
Timing how long it takes for a work item to run through a process and aggregating that data can help us identify bottlenecks, see opportunities to improve, understand the true causes of slowdowns, and determine if our recent changes affected our delivery positively or negatively.
How to Measure Cycle Time
Measure a cycle time to find out how long it takes for something to happen. When you make changes to the process, you can see if you are positively or negatively impacting the time it takes to accomplish work. Changes in cycle time are an indicator of whether to continue with recent changes or to pivot off of them.
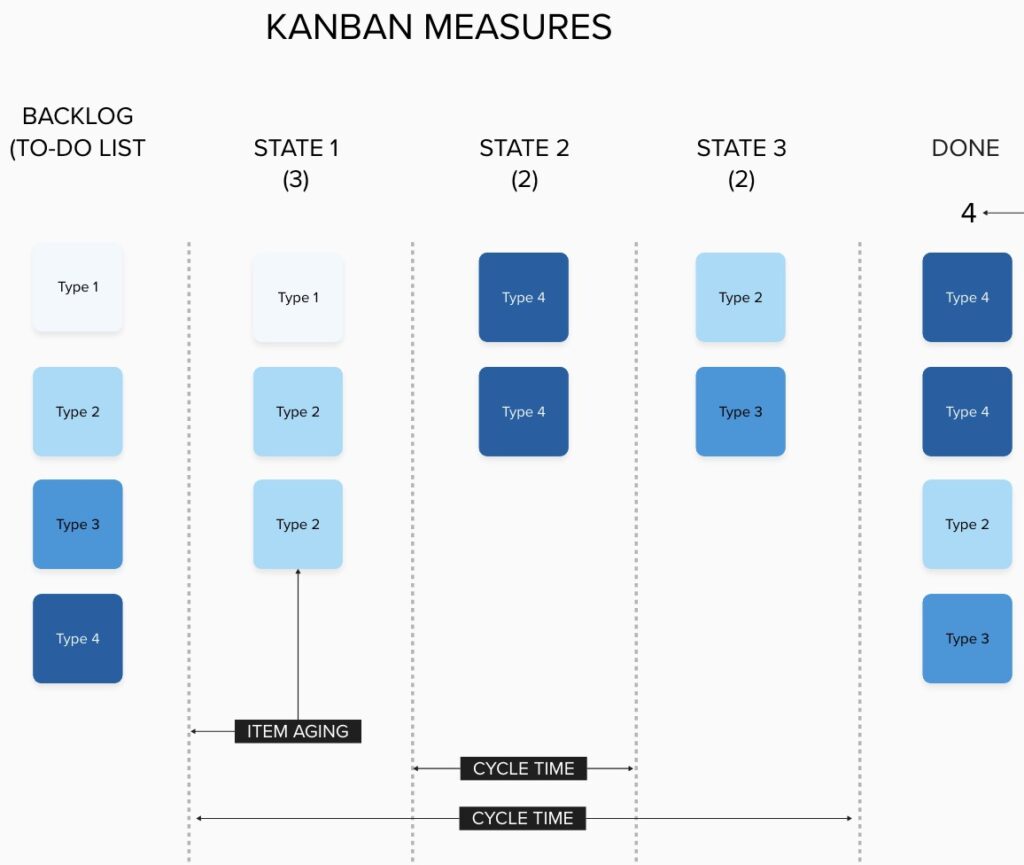
To measure the cycle time, count the number of days that the item spent being worked:
- Count one day the moment the item is started
- Use simple techniques to measure. Minutes and hours don’t matter unless your work needs to be completed in mere minutes or hours. Most people in most situations will measure cycle time in days.
- Record the cycle time for each item as it completes
You can now create two really cool visuals that are very, very informative:
- A cycle time scatterplot that helps you forecast future item completion
- An average cycle time trend analysis that helps you see if the changes to your process are positively or negatively affecting speed of execution.
Cycle Time Scatter Plot Diagram
Cycle time, unlike estimation techniques, is a lagging indicator. It is facts. It is data. The work item took the amount of time you measured. When you pile up the cycle times of all of the completed work item types over time, you can assemble them into a scatter plot diagram like this one:
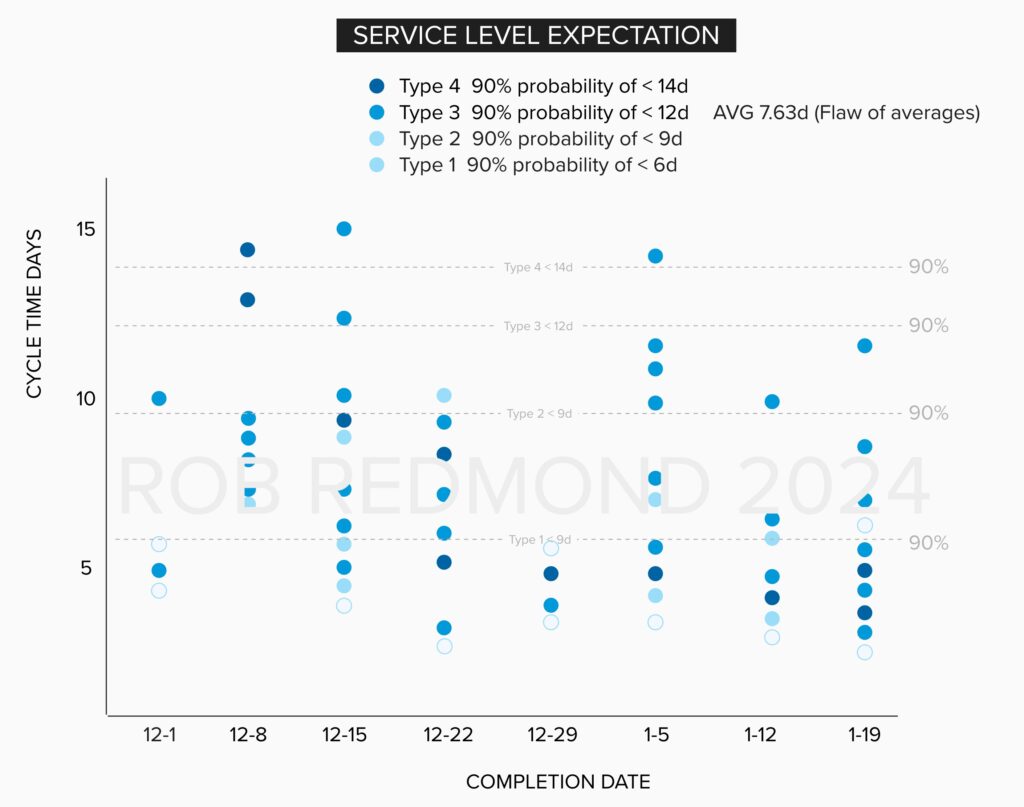
This chart is probably the most powerful visual you can have to predict how long it will take to do future work of the same type. There are 30 items of type 3 that were completed in the visual above. 90% of 30 is 27. If we put a line just under the top 3 remaining items, we now can see the number of days that type 3 items take to complete: 12 days.
We know there is a 90% chance we will complete any item of type 3 in 12 days. This number of days becomes our service level expectation. Anyone bringing us a type 3 item can be pretty confident that barring some exception, there is a 90% chance we will complete that work in 12 days once we start it.
Average Cycle Time and Flaw of Averages
Average cycle time trending can show that cycle time is shortening over time, which is in almost all cases a really good thing. I don’t recommend using the average cycle time for any sort of predictive purpose, as you will fall victim to the Flaw of Averages. Note the average cycle time for type 3 items is 7.63 days. Would you offer 8 days as a service level expectation? I would not. I prefer the 90% chance of 12 day completion once started.
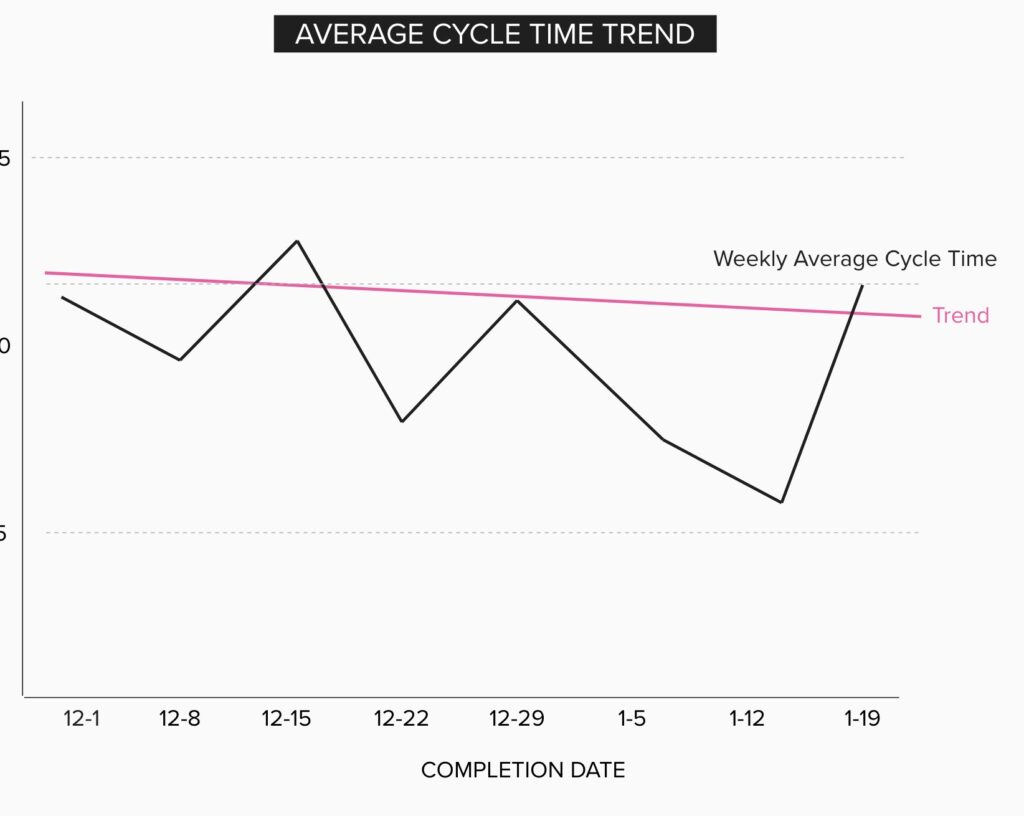
We can build trends and see if cycle times are going up or down by week. We can set predictive thresholds for any probability of a how long it will take.
Tools
You can use a tool to generate this scatterplot. I’ve made them in Excel before. There are some web-based tools that are out there selling seats which generate such charts natively. However, I find that most groups are moving slowly enough that it is pretty easy to create something like this in Mural, Miro, or PowerPoint by hand. Measuring cycle time is usually easily done by hand for an individual or a single team. I find that highly advantageous since we don’t have to beg for customizations and changes. I can just edit my drawing myself.
A large enterprise is probably not going to allow any serious business to be measured using a guy counting on his fingers and plugging numbers in Excel for very long. Eventually, you will have to use a tool in order to scale your ability to see measures from across an organization or generate them when you are absolutely slammed with other work. This can be difficult because often by the time you read an article like this, your organization already has purchased a bazillion seats for a bazillion dollars, and trying to move to a new tool will cost millions.
However, if you can choose a tool, make sure that it understands and makes great cycle time charts. If this were a for-profit blog, I would now pivot to an ad from my sponsor the makers of this incredible tool for measuring cycle time. But since it isn’t, I will instead recommend that you look for a kanban tool that features cycle time scatter plots, configurable cycle time start and end points, average cycle time trending, and monte carlo analysis to help you forecast completion of an extensive fixed-scope backlog.
Let’s look at examples from the two biggest agile tool sets out there.
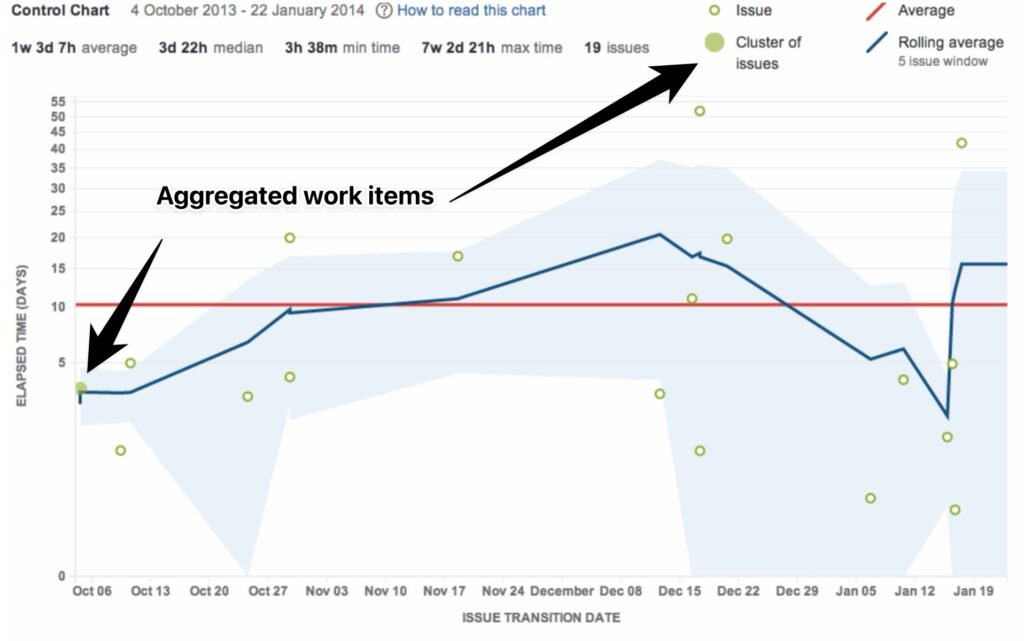
Jira Control Chart has a cycle time scatter plot. But if you want to know how many days within a 90% probability your team completes a work item type, you can’t. It doesn’t display types of work. It also aggregates multiple completed work items into a single dot as a “cluster of issues.” I don’t know if this can be configured away, but while it is active, it prevents you from counting the number of issues and drawing a horizontal percentile probability line in your scatter plot. And frankly, that’s the only reason to make a scatter plot! Average cycle time is just a rolling line graph.
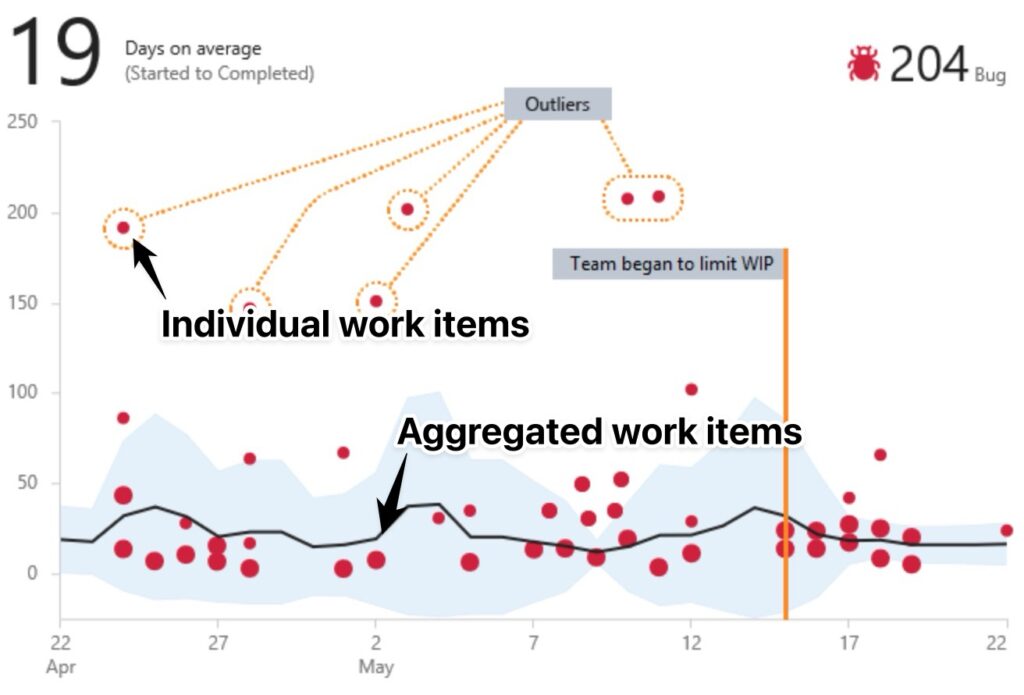
Azure DevOps has the same problem. If a number of issues are completed at the same time and length, the tool aggregates them into a larger “dot.” This prevents you from identifying where to draw a horizontal probability line.
Both Jira and Azure Devops are fine for average cycle time trends. The standard deviation display in ADO is interesting, if unnecessary because I can visually see the outliers and don’t really need that help. Features that allow for work items to have multiple types miss the point, since now I have lost fidelity of reporting on my service level expectation to give my stakeholders based on the type of work.
Any tool that can generate a Diagram of Cumulative Flow can help you see patterns, but you may not get a lot of team or business value from looking at one. I have never found myself diagnosing a problem in an organization and said, “Let me see your Cumulative Flow Diagram.” I have always found myself asking them, “Let me see your cycle time scatter plot. No? Here’s how to make one.” CFD’s I categorize more as Agile Artwork. It’s interesting, but not particularly informative. CFD’s are more like infotainment.
For these reasons, I find myself drawn back to drawing my own chart in any scenario where items are completed infrequently enough that it is not a large lift for me to copy and paste a dot and align it with other dots and then count them and move my probability line.
How do we know if we are agile?
I am frequently asked to perform assessments on organizations to tell them if they are agile or not. Agile assessments usually have a bunch of survey questions which I am guilty of having asked in the past myself such as,
- Does your team hold a retro every sprint?
- Do you use a backlog?
- Is the team allowed to learn that the rest of the scope is of diminishing returns and abandon the current work for more valuable work?
But those are process and policy questions. They are not business outcomes. The desired business outcome is that it shouldn’t take us months to decide that a feature is a great idea and put something together to test if that is true. And we shouldn’t have to kill ourselves to go that fast. It should just happen during the normal course of doing business.
My answer is to ask them how many days it takes for an idea to go up for sale or for a new idea or feature to become reality. When they say they do not have that time, then my answer is that an assessment is probably not useful. Instead, start measuring cycle time.
You know you are a fast sprinter when you can run a 100 meters in less than 11 seconds. You know you are agile when you learn something and your response is in the market mere days later.
What is a good Time to Market cycle time for an organization? I can’t answer that without knowing what you are delivering to market, what “market” means to you, and what purpose for delivering it you have. A company that has a mobile app should be able to produce a response in less than a week. A company building aircraft? I don’t know. I have never managed building an aircraft. Probably months or years because of safety concerns and the inability to back out problematic features without an airplane falling out of the sky!
There is no doubt about this, however: The best Time to Market for your organization is a shorter one. Learning about cycle times, starting measurements on items of curiosity to increase transparency and remove waste to increase flow is the best place to start when you want to speed things up.